Identify noisy alerts in your Slack channel


5 min read
How the Doctor Droid bot helps in keeping your alerts actionable

It's a typical day and you are working on a feature that's supposed to be delivered in this sprint. You have 5 days left and feel comfortable as you've experience with this service.
You take a coffee break in the evening and decided to check your slack messages from last hour. You notice a Memory alarm in Prod DB, similar to the one that came couple of weeks back (which became an incident). But wasn't this fixed? Or did you forget to add it to tech debt? Nevermind, you just clear the cache and add it in a note to discuss in next tech debt discussion.
You release the feature and it works with almost no glitches (can there ever be bug free code?? Or does it just go undetected?) 😎
Next week, everyone's asked for suggestions for tech debt during sprint planning and you think you had something, but don't recall. The meeting is done and 2 weeks later, it's the same alert again. ☠️
Prioritising Alerts & Tech Debt is difficult
As an engineer, there are multiple challenges you face when it comes to prioritising alerts:
Cumbersome to identify issues: you need to take the pain to go through the alerts in your slack channels, then trying to look for them in your monitoring tool, then compile the report manually.
Incomplete picture: Lack of data leads to high dependency on tribal knowledge and heresay, hence, leading to risk of forgetting things.
Recency Bias: As it is a time consuming and manual activity, you might end up depending on the most infamous Recency Bias to prioritise and fix issues**.**
Hence, you might, once again forget about that DB memory issue until it alerts you again.
Unless . . .
Introducing Alert Insights by Doctor Droid
Doctor Droid's Alert Insights helps you identify patterns & trends in your alerts in a jiffy. Add the Doctor Droid bot to your Slack channel and get an instant analysis of alerts in your channel. These insights can help you make all the alerts in your Slack channels actionable and noise-free.
Weekly Pattern of alerts:
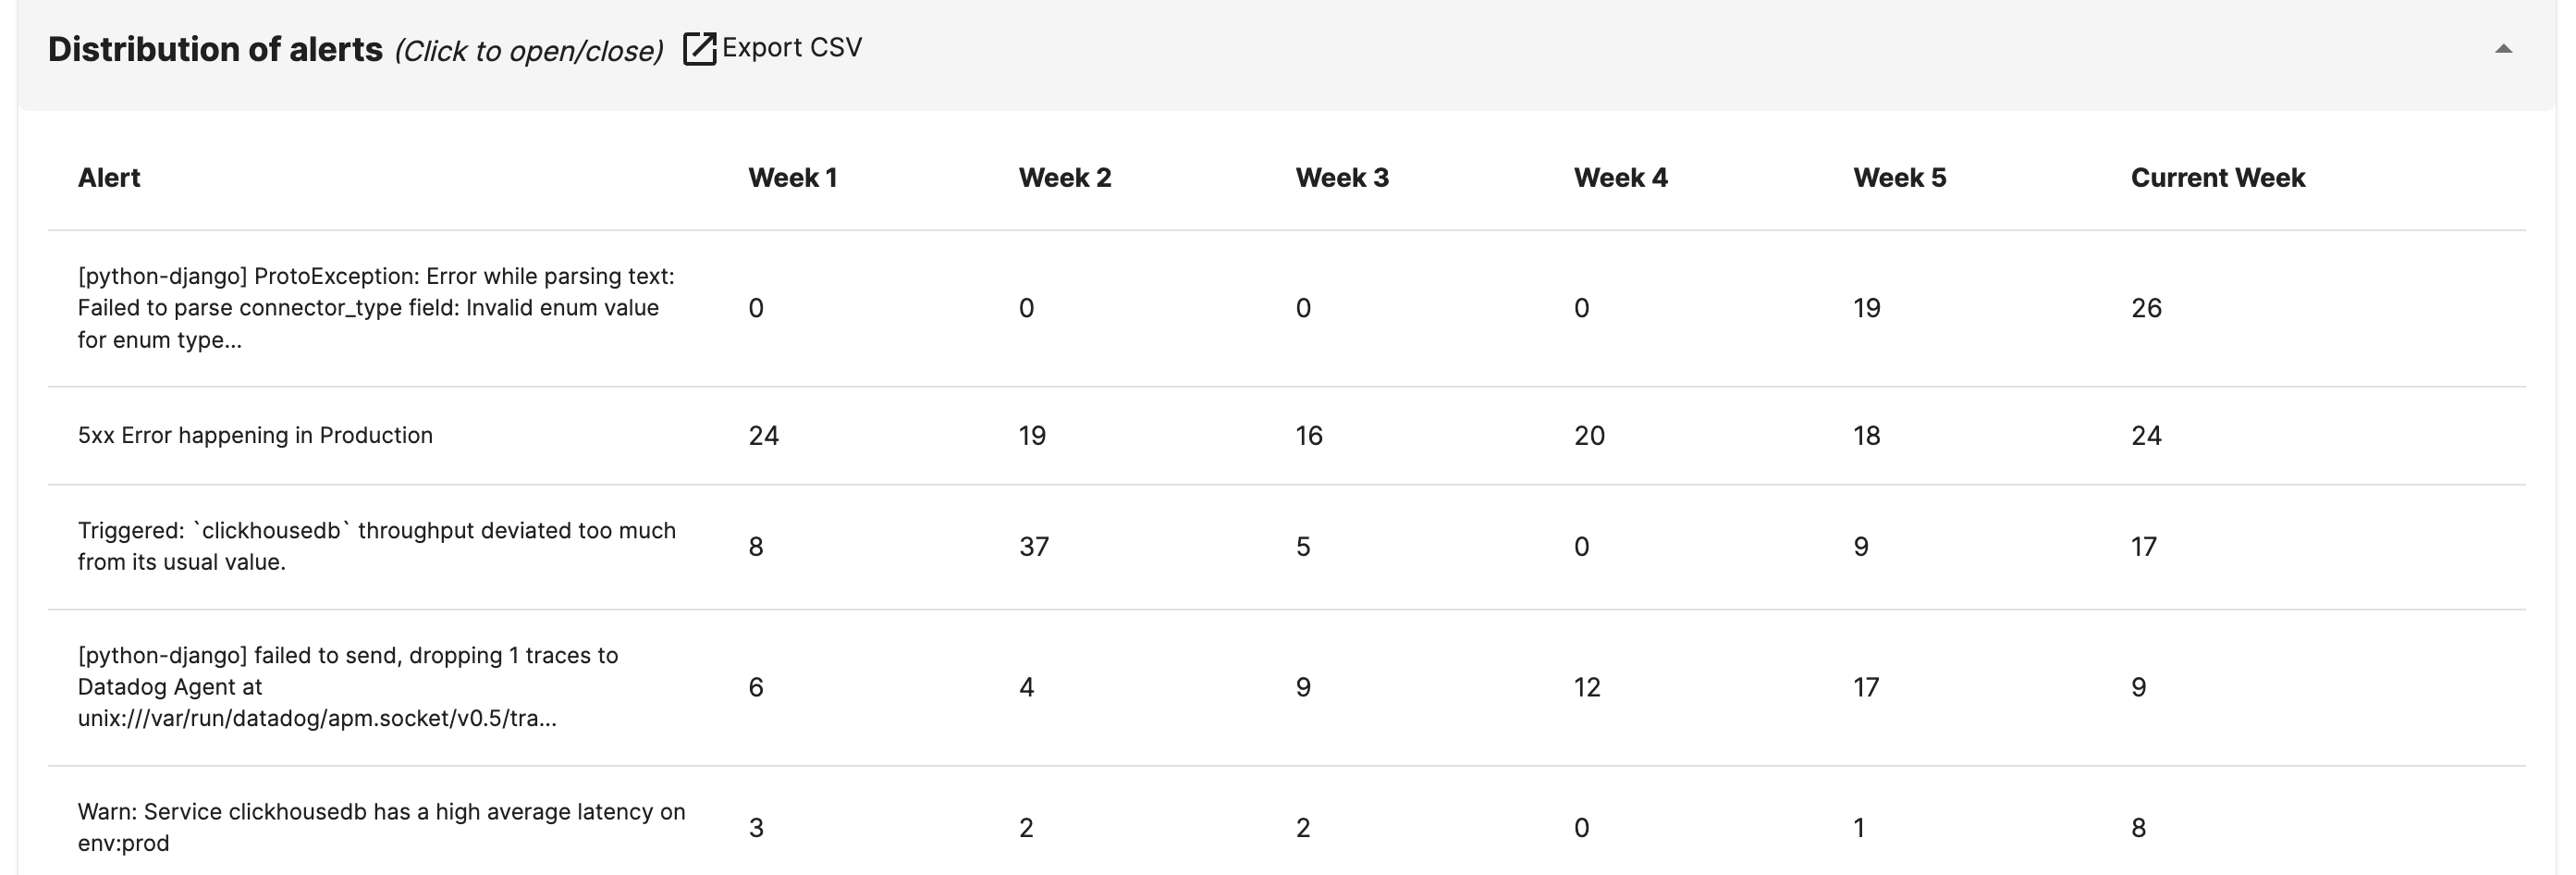
The moment you add the bot to your channel, you will be able to see the list of most frequent alerts in a table, distributed week over week. This insight will help you identify:
(a) Repetitive alerts in your channel that might be creating noise and needs fine-tuning
(b) New alerts that might have started coming recently in your channels
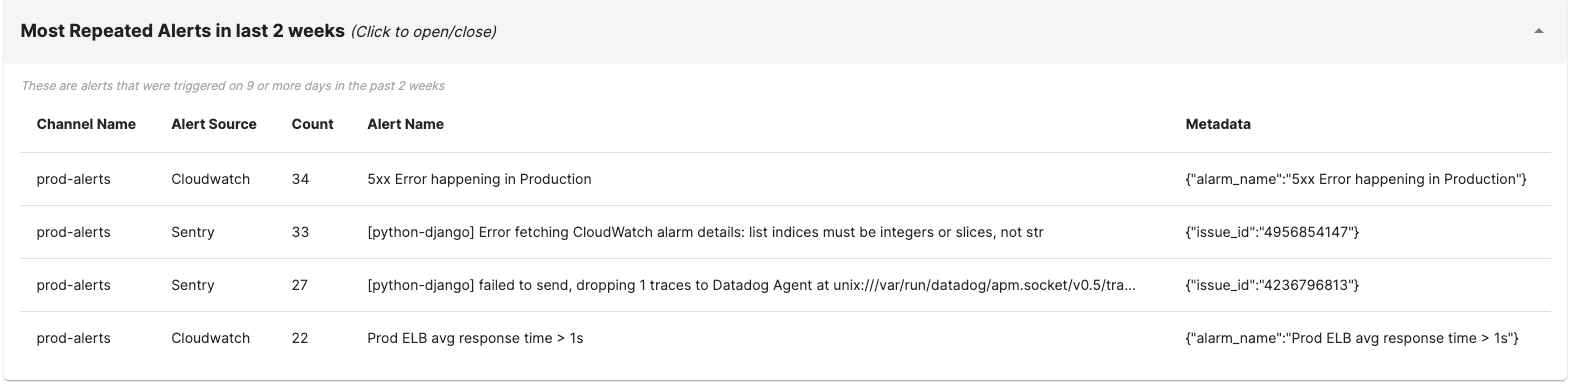
Identify Noisy Alerts:
Our bot automatically shares list of alerts that are most likely noisy and are creating distraction for engineers in the Slack channel. This needs to be actioned upon as it could be a primary reason why people might be muting alert channels in your team.
Understanding relative noise in the team:
Understand the alert management quality across different teams by comparing the trends of alert volumes and frequency across different channels.
Alert Quality Score:
The tool also provides you with an Alert Quality Score.
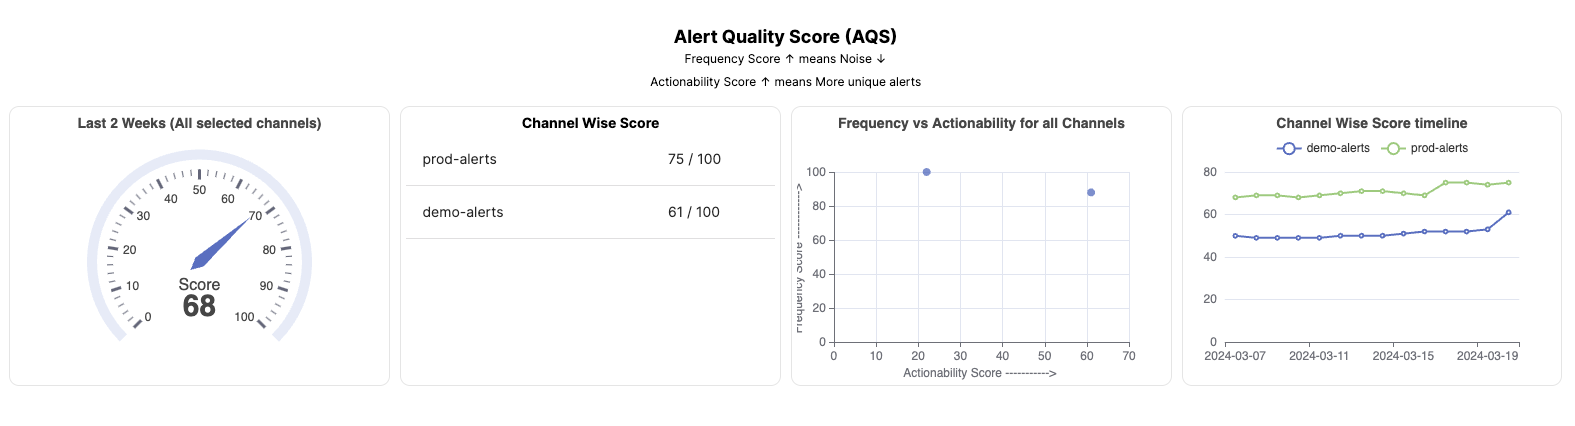
The Alert Quality score is a combination of two parameters:
How frequent are your alerts?
How actionable are your alerts?
Frequency helps you measure how often your engineers might be getting distracted with notifications where as actionability helps you measure how much does your team trust these alerts. With a combination of these two, the score is the perfect way to measure and improve your alert quality.
Deep Insights about bottlenecks in your stack
You already have all the data.
Doctor Droid bot goes a step forward to derive deeper insights, customised to your stack.
How?
Your alert has insights like which service might be impacted, which API might be delayed or what component is having an error code. Our bot parses these alerts and groups them into different buckets. If you're looking to understand your service health, you might be able to identify the most frequent alert, by API name in one of the panels in the dashboard.
For instance, in the below graph, Sentry alerts are automatically grouped by it's issue-id. These can help you segregate errors that need to be muted in Sentry vs those that need to be fixed.

As a company building tools for improved observability for teams, we have a deep understanding of different tools in the ecosystem. Sentry is not the only tool that we have deep analysis capabilities of. Here are some other tools where we have spent significant time on the right grouping of alerts:
AWS:
To understand the health of your infrastructure, you might find some of the following panels useful:
Distribution of alerts by Component Name / AWS Service Name
Distribution of alerts by Resource / API name
Distribution of alerts by Pod Name
DB InstanceID or CacheClusterID
"alarm_name", "metric_name", "cache_cluster_id", "cache_node_id", "error", "DBInstanceIdentifier"
Grafana/prometheus alert-manager:
Distribution of alerts by alertname, podname
Distribution of alerts by rulename
Datadog:
- Grouping of alerts by monitor id, service name and env
New Relic:
- Grouping of alerts by condition_id, policy_id or impacted entity.
Robusta:
- Grouping of alerts by "alertname", "device", "job", "container", "endpoint", "cluster", "namespace", "pod", and "service"
Tools Supported by Doctor Droid bot:
Generating the alert insights is a one-click integration with your communication tool & observability tool to our platform. We deeply understand the schema and data of different tools and can get started in a jiffy. ⚡️

To get your own insights, sign up and add the bot to your slack channel today!