Observability | Simplified
4 min read
Understand the meaning of observability, monitoring, instrumentation and more!

Observability is a common term thrown around in our developer circles; often coupled with monitoring & alerting. A lot of popular tools claim to be solving your problems end-to-end and a lot of exchanges go on around open source technologies and protocols around this. This article tries to simplify some of these terms and how observability really works.
What is Observability?
Observability is the practice of having data about your system that can help you know the unknown. It doesn’t refer to your metrics dashboards (that is monitoring) or to the alerts you set up. The process of instrumenting and collecting data that enables you to observe how your software systems behave, be aware of their health and gather detailed knowledge of how they are working is observability.
There are 3 common types of data sources (called telemetry data) that help you uncover the truth:
1. Logs
If you’re a developer, the first thing you add while testing your code is logs. They can be either system generated (e.g. by nginx) or manually generate and can have a variety of data that helps in knowing vital information about the execution of the code.
2. Metrics
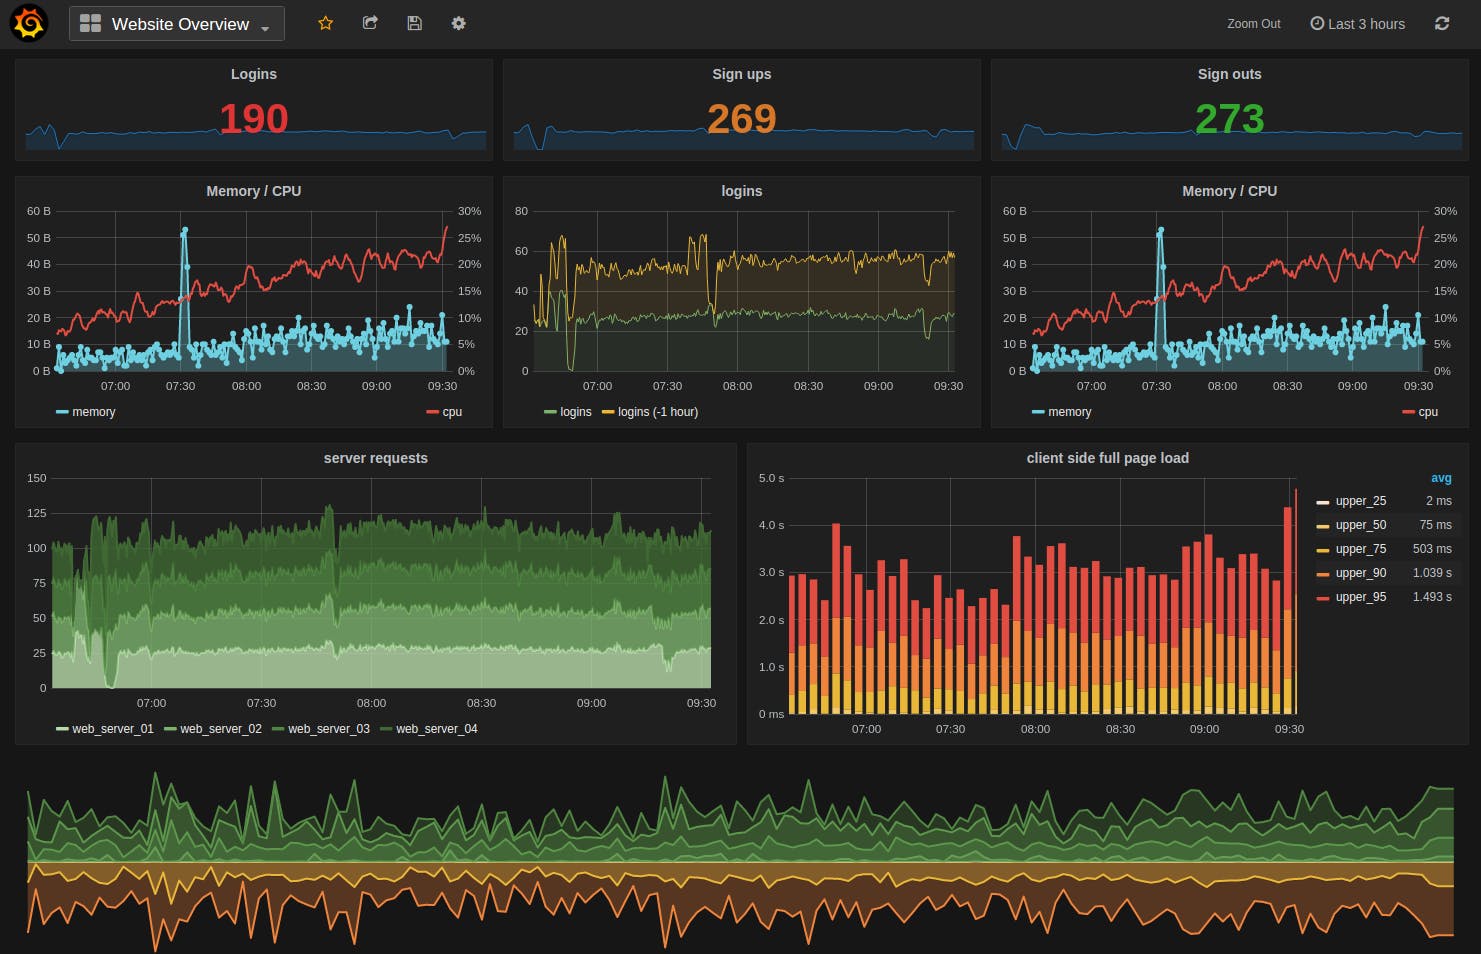
They are numerical values quantifying a certain behavioural aspect of your software, which is saved in a time series storage for seeing over a period of time. Most software emit metrics, be it your service running on a pod or the k8s cluster itself.
To put it into context, the throughput (Requests per minute) or Avg response time of your API calls per minute are some metrics that you'll be familiar with and must have noticed in dashboards.

3. Traces
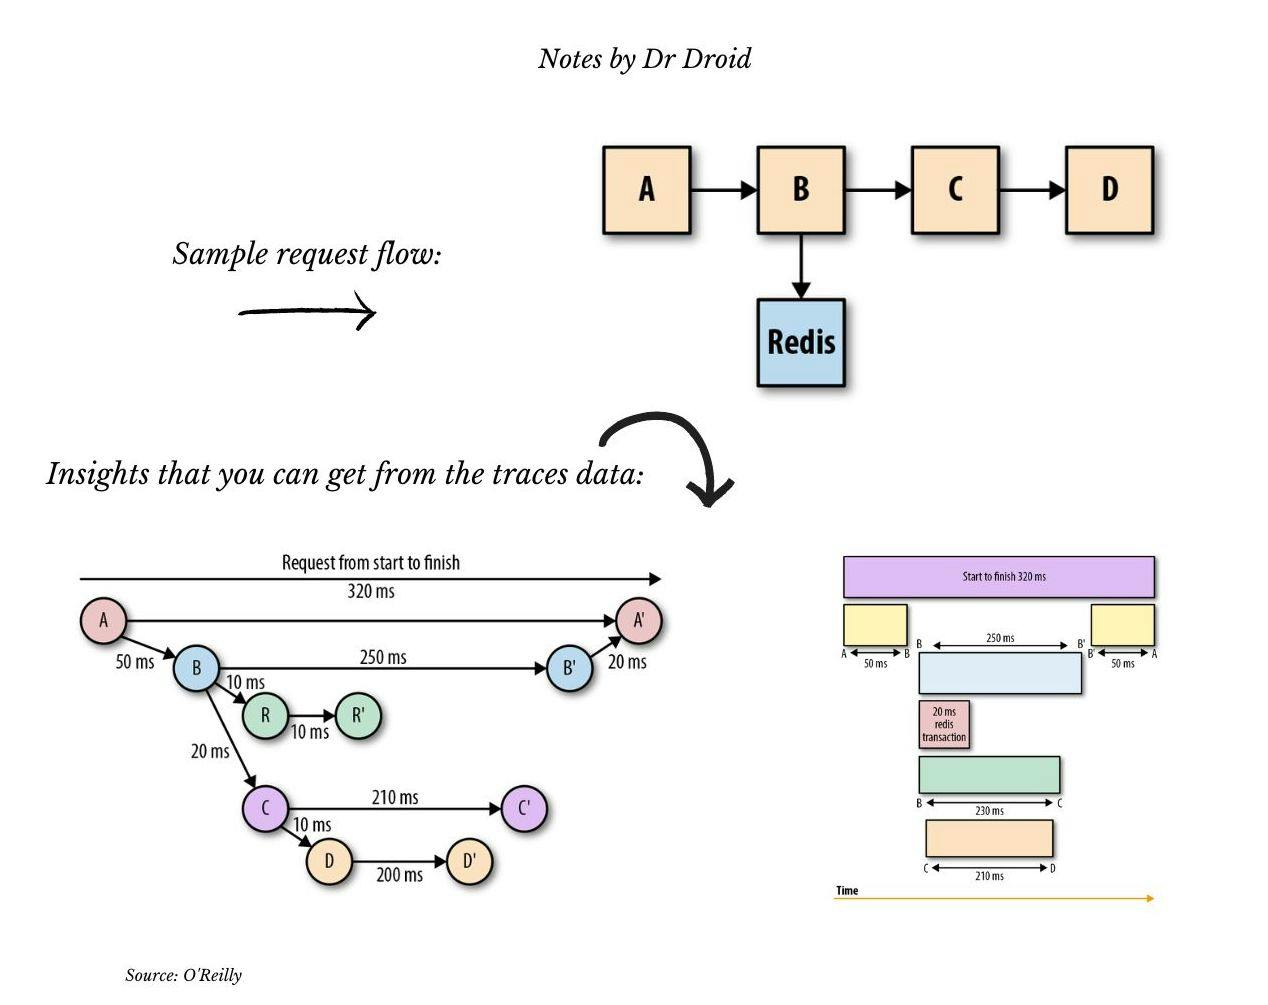
You can think of traces as a specialized form of logs, designed to give details around the set of steps your “request” took. It splits your entire execution into smaller chunks, including code level logic, DB queries & downstream calls. These executions (called “spans”) are easily identifiable with their names and their prefixes. Common names that you might have seen if your team has already setup traces:
1. Datastore - DB queries and connection handling steps 2. External - Calls made outside your service over a network protocol like HTTP, MQTT etc. 3. Function - Code execution within the current program
There are other span names that can come up based on your instrumentation agent.

What is monitoring?
Monitoring is the part where you use the telemetry data to set up dashboards and visualisations of metrics you already know that you need to track to view the system's health at any point in time. Observability means having data such that even when you don’t know what you need to track, you can investigate your system deeply enough.
How does this work?
Below is a sample flow of how observability, when integrated within your micro-services architecture, looks like.

Instrumentation: Refers to how the telemetry data is generated within the system. Typically, it involves adding a small piece of code/program (instrumentation agent) to your existing code.
Ok, but do I need to know how this works? 😬
No. Not really. You can decide to go ahead with a commercial tool and all you need to do is follow a couple of lines of instructions to set it up. All the steps mentioned above are taken care of by them so the details are abstracted out and you can directly start monitoring your system.
Caveat: As your system scales, the cost of the commercial tools will start pinching and you might consider moving to OSS.
Bonus section:
Over the last couple of years, the term o11y is starting to get popular for the word Observability (e.g. The event o11yfest).
Now you say how? Find the output of this code to know how:
def word_encoder(word):
    word = word.replace(" ","") #removing spaces
    mid_char_count = len(word) - 2
    encoding = word[0].lower() + str(mid_char_count) + word[-1].lower()
    print(encoding)
    return encoding

word_encoder("observability")
Are you thinking “where is this inspiration coming from?” Try to find the output for these function calls and you'll know the answer :)
word_encoder("kubernetes")
word_encoder("Andreessen Horowitz")
Fun fact: These words are “numeronym”
If you have come across any other jargon that needs to be simplified, mention them in the comments!
We are shortly publishing a comparison of the most relevant open source & commercial tools for observability. If you would like to get a copy of it, sign up below!
If you’re looking for a tool to get better visibility on your APIs, application, integrations and errors, check out Hyperlook — it’s a error tracking and alerting platform for next-gen of software developers.
