

Missing from this list: an AI that actually fixes the issue →
Connect your tools and ask AI to solve it for you
Introduction to OpsGenie Alerting
Efficient incident management is crucial for maintaining the reliability and availability of critical systems. OpsGenie provides a comprehensive platform for managing alerts and incidents, ensuring teams are equipped to handle issues swiftly and effectively.
This blog will cover the best practices for using OpsGenie, explore its key features, and discuss how to configure alerts for maximum efficiency. We will also look at advanced alerting techniques and integrations that can help optimize your incident response workflows.
What is OpsGenie?

https://www.atlassian.com/software/opsgenie
OpsGenie is a robust alerting and incident management platform developed by Atlassian. It acts as a central hub for consolidating and managing alerts from various monitoring tools, ensuring the right team members are notified at the right time.
By streamlining on-call management, escalation workflows, and integrations, OpsGenie simplifies incident resolution and improves operational efficiency.
Overview of OpsGenie as an Alerting and Incident Management Platform
OpsGenie helps organizations streamline their alerting processes by routing notifications, managing on-call schedules, and reducing unnecessary noise.
It integrates seamlessly with a wide range of monitoring, ticketing, and collaboration tools, making it an essential component of modern incident management.
Key Features:
- On-Call Schedules: Automate on-call rotations to ensure round-the-clock coverage without manual intervention. It also prevent gaps in coverage with predefined, flexible scheduling options.
- Escalation Policies: Automatically route unresolved alerts to backup responders or higher-tier teams. It creates multi-tier workflows to ensure no alert is missed.
- Integrations: Connect with over 200 tools, including Prometheus, Datadog, Slack, and Jira. You can enable bi-directional updates to synchronize incident management workflows.
Importance of Effective Alerting
Effective alerting ensures incidents are resolved quickly and with minimal disruption. OpsGenie enhances this process by focusing on the following:
- Reducing Alert Fatigue:Eliminate redundant notifications through deduplication and noise suppression.Focus team attention on actionable alerts to improve efficiency and prevent burnout.
- Ensuring Timely Response to Critical Incidents:Alerts are routed based on predefined schedules and escalation rules.Unresolved alerts are escalated to ensure a prompt and coordinated response.
By leveraging OpsGenie’s capabilities, organizations can improve the reliability of their systems, minimize downtime, and create a structured approach to managing critical incidents.
Key Alerting Concepts in OpsGenie
OpsGenie is built around core alerting concepts that enable teams to manage incidents efficiently and respond to issues in a timely manner.
Understanding these concepts described below is crucial for setting up a robust alerting system that minimizes downtime and ensures smooth workflows.
Alerts
An alert is a fundamental entity in OpsGenie, representing an incident or issue that requires attention. Alerts act as the primary means of notifying teams about critical events in their systems.
Key Properties of an Alert:
- Message: A concise description of the issue, such as "High CPU usage on server" or "Database connection timeout."
Teams and Routing Rules
OpsGenie allows you to create teams and define routing rules to deliver alerts to the appropriate responders.
- Associating Alerts with Specific Teams:Each team in OpsGenie can have its own on-call schedule, escalation policies, and routing rules.Example: A DBA Team handles database-related alerts, while an Ops Team manages server health alerts.
- Defining Routing Rules:Routing rules determine where alerts are sent based on their properties, such as priority, tags, or source.Example:Alerts tagged with database are routed to the DBA team.P1 alerts bypass default rules and are sent directly to on-call responders.
Escalation Policies
Escalation policies ensure that unacknowledged alerts don’t go unnoticed, providing a structured way to escalate issues through predefined workflows.
- Handling Unacknowledged Alerts:If an alert isn’t acknowledged within a specified time, it’s automatically escalated to the next level in the policy.
- Setting Up Multi-Tier Escalation Workflows:Escalation policies typically involve multiple tiers, such as:Tier 1: Notify on-call responders in the primary team.Tier 2: Notify backup responders if no one responds within 10 minutes.Tier 3: Escalate to team leads or managers for unresolved issues.
On-Call Schedules
OpsGenie’s on-call scheduling feature ensures that there’s always someone available to respond to alerts, minimizing response delays.
- Configuring On-Call Schedules:Create on-call rotations with predefined shifts (e.g., weekly, daily).Allow team members to swap shifts or override schedules as needed.
- Timely Alert Resolution:Alerts are automatically routed to the person on duty, reducing the risk of missed incidents.Example: A schedule for the Ops Team could rotate weekly, with one engineer on-call at any given time.
By leveraging these key concepts—alerts, routing rules, escalation policies, and on-call schedules—OpsGenie provides a structured framework for managing incidents effectively. These features ensure alerts are actionable, routed to the right people, and resolved in a timely manner.
Creating and Managing Alerts in OpsGenie
OpsGenie provides a flexible framework for creating and managing alerts, ensuring they are routed appropriately and remain actionable. By setting up well-defined alert rules and following best practices, teams can reduce noise, streamline responses, and focus on critical incidents.
Setting Up Alert Rules
Alert rules in OpsGenie define how alerts are created, routed, and managed based on specific conditions. These rules ensure that alerts are properly categorized and delivered to the right teams.
- Creating Alert Rules to Match Specific Criteria:Alerts can be configured to trigger based on predefined conditions, such as priority, tags, or source.Example:A rule for high-priority alerts (P1) ensures they are routed directly to a dedicated incident response team without delays.
- Defining Alert Tags and Custom Properties:Tags allow for categorization and help identify the nature of the alert (e.g., database, network, application).Custom properties, such as severity or service_name, can be added to provide additional context.
Example Alert Rule:
- Condition: Alert priority = P1 AND tags include the database.
- Action: Route the alert to the DBA team’s on-call schedule.
- Escalation: If unacknowledged for 5 minutes, escalate to team lead.
Best Practices for Configuring Alerts
To ensure alerts are effective and actionable, it’s important to follow best practices during their configuration.
- Focus on Actionable Alerts Only:Avoid creating alerts for non-critical or transient events to reduce unnecessary noise.Ensure each alert provides sufficient context and clear instructions for resolution.
- Use Dynamic Tags for Better Alert Categorization:Leverage dynamic tags to automatically classify alerts based on source or conditions.Example:Alerts from a database monitoring tool could automatically include the database tag.Alerts related to production environments can include the production tag.
- Group Similar Alerts to Reduce Noise:Use OpsGenie’s deduplication features to group multiple alerts from the same source into a single notification.Example: Instead of receiving multiple alerts for high CPU usage across nodes, group them under a single incident.
Example Deduplication Rule:
- Condition: Alerts from the same host with the same error message.
- Action: Combine into a single alert and update the count.
By setting up targeted alert rules, using tags effectively, and grouping similar notifications, you can ensure that OpsGenie alerts are both meaningful and actionable.
Advanced Alerting Features in OpsGenie
OpsGenie offers advanced alerting features that allow teams to fine-tune their incident response processes. These capabilities ensure that alerts are appropriately prioritized, routed dynamically, and enriched with actionable context for efficient resolution.
Priority-Based Alerting
Alert priorities in OpsGenie range from P1 (Critical) to P5 (Low), helping teams manage their responses based on the severity of incidents.
- Configuring Alert Priorities:Assign priority levels to alerts based on their impact and urgency.Example: A database outage would be a P1 alert, while a minor CPU spike might be a P4 alert.
- Sample Use Cases for Priority Levels:P1 (Critical): Complete system outages or critical application failures. These require immediate attention and should bypass default rules to notify on-call engineers directly.P2 (High): Degraded performance or partial outages affecting a subset of users.P3 (Medium): Non-critical warnings, such as resource usage nearing thresholds.P4 (Low): Non-urgent system errors or maintenance updates.P5 (Info): Informational alerts for logging or monitoring purposes only.
Dynamic Alert Routing
OpsGenie’s dynamic routing ensures alerts are directed to the right teams based on predefined rules, tags, and conditions.
- Leveraging Tags, Teams, and Conditions:Tags: Use tags to categorize alerts (e.g., database, frontend, network) and route them to specialized teams.Teams: Assign alerts to specific teams based on expertise or ownership.Conditions: Define routing rules using conditions like alert source, priority, or environment.
- Example: Directing Alerts with Database Tags to the DB Team:Condition: If an alert contains the database tag.Action: Route the alert to the DBA Team on-call schedule.Escalation: If unresolved within 5 minutes, notify the team lead.
Alert Enrichment
Alert enrichment adds valuable context to alerts, making them easier to understand and act upon. OpsGenie enables you to integrate alerts with external tools to enhance their usefulness.
- Adding Meaningful Context Using Integrations:Integrate monitoring tools (e.g., Prometheus, Datadog) to attach metrics or logs to alerts.Include links to dashboards or system health summaries for quick troubleshooting.Enriching Alerts with Links to Runbooks, Dashboards, or Logs. Example:Add a link to a runbook with resolution steps.Include a link to a Grafana dashboard showing system metrics.Attach logs from a monitoring tool for detailed error analysis.
Enrichment Use Case:
- A P1 alert for a failed deployment includes:A link to the CI/CD pipeline logs.A link to a runbook with rollback instructions.A Grafana dashboard showing system metrics before and after the failure.
By leveraging priority-based alerting, dynamic routing, and alert enrichment, OpsGenie helps teams streamline their incident response processes. These features ensure alerts are actionable, routed to the right people, and equipped with the context needed to resolve issues efficiently.
How to Integrate OpsGenie with Monitoring Tools
OpsGenie’s ability to integrate with a wide range of monitoring and collaboration tools ensures seamless incident management.

https://www.atlassian.com/software/opsgenie
By routing alerts from tools like Prometheus and Datadog or managing them through Slack, OpsGenie provides a centralized platform for efficient alert handling. Let’s learn in detail.
Prometheus Integration
Prometheus is a popular open-source monitoring tool that collects and stores metrics. Integrating Prometheus with OpsGenie allows alerts to flow directly into OpsGenie for streamlined incident response.
- Creating Alerts in Prometheus Routed to OpsGenie:Alerts generated in Prometheus are routed to OpsGenie via Alertmanager.Define alert rules in Prometheus to trigger notifications for critical events.
- Configuring prometheus.yml for OpsGenie Integration:Add the OpsGenie integration to Alertmanager’s configuration file:
- Configure routing rules to send alerts to OpsGenie

3. Validation:
- Test the integration by triggering a sample alert in Prometheus.
- Verify that the alert appears in OpsGenie’s dashboard with the correct priority and tags.
Datadog Integration
Datadog provides comprehensive monitoring and observability for cloud environments. Integrating Datadog with OpsGenie ensures that monitor alerts are routed to the right team for faster resolution.
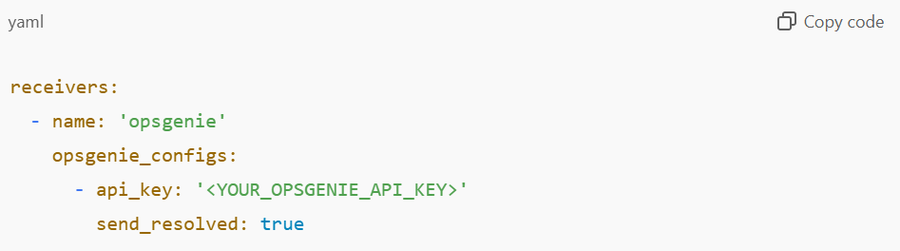
- Sending Datadog Monitor Alerts to OpsGenie:In the Datadog dashboard, navigate to Integrations > OpsGenie.Enable the integration and provide the OpsGenie API key.
- Using Datadog Tags to Customize Alert Routing in OpsGenie:Tag alerts in Datadog (e.g., env:production, team:db) to route them to specific teams in OpsGenie.In OpsGenie, create routing rules based on these tags:Alerts with team:db are sent to the DBA Team.Alerts tagged with env:production are prioritized as P1.
- Validation:Trigger a Datadog monitor alert and confirm it appears in OpsGenie with the appropriate priority and routing.
Slack Integration
Slack is widely used for team collaboration, and integrating it with OpsGenie allows teams to receive and manage alerts directly within their Slack channels.
- Receiving and Managing OpsGenie Alerts via Slack:Configure the OpsGenie Slack app to send alerts to specific channels.Alerts can be acknowledged, escalated, or resolved directly from Slack.
- Setting Up Bi-Directional Updates from Slack to OpsGenie:In OpsGenie, enable the Slack integration and provide the Slack workspace credentials.Grant OpsGenie permissions to post and manage messages in designated Slack channels.
- Example Workflow:An alert for high CPU usage is sent to the #on-call channel in Slack.The on-call engineer acknowledges the alert from Slack using /opsgenie acknowledge <alert-id>.Status updates are synchronized between Slack and OpsGenie in real-time.
Integrating OpsGenie with Prometheus, Datadog, and Slack centralizes monitoring and collaboration, ensuring alerts are actionable and efficiently managed.
Best Practices for Alerting Using OpsGenie
Efficient alerting is critical to maintaining system reliability and avoiding burnout for on-call teams. OpsGenie offers powerful tools and features to streamline alert management, but following best practices ensures alerts are effective and actionable.
Let’s look at some of the important best practices for alerting using OpsGenie in details.
Avoiding Alert Fatigue
Alert fatigue occurs when teams are overwhelmed by excessive notifications, reducing their ability to respond effectively. OpsGenie helps mitigate this with features designed to focus on relevant, high-priority alerts.
- Prioritize Alerts Based on Impact and Urgency:Assign appropriate priority levels (P1 to P5) to alerts to ensure critical issues are addressed first.Example: Database outages should be P1, while informational updates remain P5.
- Group Repetitive Alerts Using OpsGenie’s Deduplication Feature:Use deduplication rules to merge multiple alerts for the same issue into a single notification.Example: Instead of receiving separate alerts for every node in a cluster experiencing high CPU usage, OpsGenie can consolidate these into one alert.
Actionable Alerts
Every alert should provide sufficient context to enable responders to act quickly and effectively.
- Ensure Every Alert Has Clear, Actionable Steps:Include details like the affected system, the issue’s severity, and suggested next steps.Example: A P1 alert for a failed deployment might include rollback instructions.
- Add Contexts Such as Affected Systems and Resolution Steps:Use OpsGenie’s alert enrichment feature to attach relevant information like:Links to dashboards or logs.Runbooks or documentation with troubleshooting steps.
On-Call Management
Managing on-call schedules effectively is crucial to ensuring timely responses while avoiding team burnout.
- Rotate On-Call Schedules to Avoid Burnout:Create fair and balanced rotations so no single team member is overburdened.Example: Rotate weekly schedules among a group of engineers, with overrides for emergencies.
- Escalate Unresolved Alerts to Backup Teams:Define escalation policies to notify backup responders if the primary on-call engineer doesn’t acknowledge an alert within a specified time.Example Escalation Policy:Notify the on-call engineer (Tier 1).Escalate to the backup engineer (Tier 2) after 5 minutes of no response.Escalate to the team lead (Tier 3) after 10 minutes of no resolution.
Timely Acknowledgment
Prompt acknowledgment of alerts ensures incidents are resolved quickly, and unnecessary escalations are avoided.
- Acknowledge Alerts Promptly to Avoid Escalations:OpsGenie allows responders to acknowledge alerts immediately, signaling that the issue is being handled.
- Use OpsGenie’s Mobile App for On-the-Go Management:Engineers can manage alerts from anywhere using the mobile app, ensuring responsiveness even when away from their desks.Key features include:Acknowledge, escalate, or close alerts directly from the app.Push notifications for new alerts and updates.
By prioritizing critical alerts, providing actionable context, and implementing effective on-call management, OpsGenie users can optimize their alerting processes. These best practices help reduce noise, improve response times, and ensure a balanced workload for incident responders.
Advanced Use Cases for OpsGenie
OpsGenie goes beyond basic alerting and incident management to support advanced workflows tailored to complex organizational needs. Its automation capabilities, integration options, and customizable notifications enable teams to handle incidents more efficiently and reduce downtime.
Incident Management Workflows
OpsGenie provides tools to automate and streamline incident response processes, ensuring that teams can focus on resolution rather than manual coordination.
- Automating Incident Response with Predefined Workflows:Define workflows that trigger specific actions automatically based on alert conditions.Example Workflow:Detect a service outage through monitoring tools.Automatically create an incident in OpsGenie.Notify the on-call engineer and escalate if no response is received within a predefined time.Update stakeholders by sending status updates to Slack or email.
- Benefits of Automated Workflows:Reduce manual effort in initiating an incident response.Ensure consistency and minimize errors during critical events.Speed up resolution times by automating repetitive tasks.
Integrating OpsGenie with CI/CD Tools
OpsGenie can be integrated with CI/CD pipelines to monitor deployment processes and alert teams about failures or delays.
- Setting Up Alerts for Deployment Failures:Monitor CI/CD tools like Jenkins, GitLab, or CircleCI for failed deployments.Configure these tools to send failure alerts to OpsGenie.Example: If a deployment fails, an alert is sent to the DevOps team with logs and rollback instructions.
- Monitoring Long-Running Jobs:Set up alerts for build or deployment jobs that exceed a defined time threshold.Example: If a deployment takes longer than 20 minutes, an alert is generated to investigate possible issues.
- Benefits of CI/CD Integration:Proactive identification of deployment issues before they affect production.Faster debugging and resolution with enriched alerts containing logs or pipeline details.
Custom Notifications
OpsGenie supports a variety of notification channels, ensuring that critical alerts are delivered effectively, regardless of the responder’s availability.
- Using SMS, Email, and Voice Calls for Critical Alerts:Configure OpsGenie to send P1 (Critical) alerts via multiple channels to ensure they are noticed.Example:A database outage alert is sent as a push notification, SMS, and voice call to the on-call engineer.Email notifications are used for less urgent issues (e.g., P3 or P4 alerts).
- Customizing Notification Preferences:Tailor notification preferences by team or individual responder.Example:A network team prefers SMS for high-priority alerts.A development team may rely on email for low-priority alerts.
- Escalation with Multi-Channel Notifications:Combine notification channels to create a multi-step escalation:First attempt: Send a push notification.Second attempt: Follow up with an SMS after 5 minutes.Final attempt: Trigger a voice call if the alert remains unacknowledged.
By leveraging OpsGenie’s advanced features, organizations can enhance their incident management processes with automation, CI/CD integration, and flexible notifications. These use cases demonstrate how OpsGenie adapts to complex scenarios, ensuring efficient and reliable operations across teams.
Examples of Effective OpsGenie Alerting
Setting up effective alerting in OpsGenie ensures that critical incidents are routed to the right teams, enriched with actionable context, and resolved promptly.
Here are some real-world examples of how OpsGenie can be used to address database, application, and infrastructure issues efficiently.
Database Downtime Alerts
Database downtime can have a severe impact on application availability and user experience. OpsGenie can be configured to prioritize these alerts and route them to the appropriate team with all the necessary details.
- Routing High-Priority Database Alerts to the DBA Team:Alerts for database unavailability or query timeouts are tagged with the database and marked as P1 (Critical).Routing Rule:Condition: Alerts tagged with database and priority = P1.Action: Route to the DBA Team on-call schedule.
- Enriched Context:Add details to alerts, such as:Affected database instance name.Query logs or metrics showing error rates or slow queries.Links to runbooks for troubleshooting.
Example Alert Configuration:
- Message: "Database downtime detected: DB instance prod-db01 is unreachable."
- Context:Affected System: prod-db01Error: "Timeout while connecting to the database."Link: Database Logs
Application Performance Alerts
Monitoring application performance and detecting threshold violations helps maintain a seamless user experience. OpsGenie can be integrated with APM tools like New Relic, Dynatrace, or AppDynamics to create actionable alerts.
- Threshold-Based Alerting with APM Tools:Use APM tools to monitor metrics such as response time, error rate, or throughput.Set thresholds for alerts, such as:Response time > 500ms for 10% of requests.Error rate > 5% for a 5-minute period.
- Routing Application Alerts:Use tags like frontend or backend to route alerts to the respective teams.Example Routing Rule:Condition: Alerts tagged with frontend and priority = P2.Action: Route to the Frontend Team on-call schedule.
- Contextual Alert Enrichment:Include:Affected application name.Error rate or response time graphs.Links to APM dashboards for deeper investigation.
Example Alert Configuration:
- Message: "High error rate detected in frontend-service."
- Context:Error Rate: 8% (exceeding 5% threshold).Response Time: Average 600ms.Link: APM Dashboard
Infrastructure Health Monitoring
Monitoring infrastructure for resource usage ensures that potential issues like CPU or memory spikes are addressed before they cause downtime.
- Using OpsGenie with Cloud Monitoring Tools:Integrate OpsGenie with cloud monitoring platforms like AWS CloudWatch, Google Cloud Monitoring, or Azure Monitor.Set alerts for key metrics such as:CPU usage > 90% for 5 minutes.Memory usage > 80%.
- Routing Infrastructure Alerts:Alerts tagged with infra or network are routed to the operations team.Example Routing Rule:Condition: Alerts tagged with infra and priority = P2 or higher.Action: Route to the Ops Team.
- Contextual Enrichment:Add:Node or instance name.Metrics showing CPU/memory trends over time.Links to cloud monitoring dashboards.
Example Alert Configuration:
- Message: "High CPU usage detected on web-server-03."
- Context:CPU Usage: 92%.Memory Usage: 70%.Link: Cloud Monitoring Dashboard
By implementing these examples, OpsGenie can help teams manage database, application, and infrastructure alerts effectively.
Handling Alert Noise and Fatigue in OpsGenie
Alert noise and fatigue occur when responders are overwhelmed by excessive or irrelevant notifications, reducing their ability to address critical issues effectively. OpsGenie provides several tools and practices to help teams minimize noise, focus on actionable alerts, and maintain a balanced workflow.
Best Practices
- Use Suppressions to Block Unnecessary Alerts During Maintenance:Suppressions temporarily block alerts for known, non-critical events, such as routine maintenance or deployments.Example: When updating a database, suppress alerts related to query latency spikes or connection errors.How to Configure Suppressions:Define time-based suppressions in OpsGenie for the maintenance window.Tag alerts related to the maintenance activity (e.g., maintenance) and configure OpsGenie to block these alerts.
- Define Escalation Paths to Minimize Repeated Notifications:Repeated notifications for unacknowledged alerts can contribute to alert fatigue.Use escalation policies to ensure that unresolved alerts are escalated efficiently without overwhelming responders.Example Escalation Path:Notify the primary on-call engineer.If there is no acknowledgment within 5 minutes, escalate to a backup engineer.If still unresolved after 10 minutes, escalate to the team lead.
Leveraging Doctor Droid Alert Insights
Doctor Droid is an AI-powered alert optimization tool that integrates seamlessly with OpsGenie. It helps reduce noise and provides actionable insights to improve alerting strategies.

- Reduce Noise with Doctor Droid:Doctor Droid analyzes alert patterns and identifies redundant or non-actionable alerts.Example:Multiple alerts for CPU usage spikes across a cluster are grouped into a single notification with Doctor Droid.
- Gain Actionable Insights:Doctor Droid provides recommendations to refine alert rules and thresholds.Example:Suggest reducing the sensitivity of a memory usage alert to prevent triggers for transient spikes.
Doctor Droid Slack IntegrationDoctor Droid’s integration with Slack enhances collaboration and simplifies alert management within OpsGenie.

Demo Link: https://drdroid.io/doctor-droid-slack-integration
- Centralize Alerts in Slack:Alerts are routed to Slack channels, allowing teams to discuss and act on them without switching platforms.Example Workflow:A P1 alert appears in the #on-call Slack channel.Responders use Slack commands (e.g., /opsgenie acknowledge <alert-id>) to acknowledge or escalate alerts directly.
- Real-Time Insights in Slack:Doctor Droid provides noise reduction summaries and alert trends in Slack, enabling teams to adjust configurations quickly.Example:“Last week, 30% of alerts were marked as non-actionable. Consider revising thresholds for database alerts.”
By implementing these strategies and leveraging tools like Doctor Droid, OpsGenie users can significantly reduce alert fatigue, improve their incident response processes, and maintain a healthier on-call environment. This ensures that critical issues receive the attention they need while keeping responders focused and efficient.
Missing from this list: an AI that actually fixes the issue →
Connect your tools and ask AI to solve it for you
Ready to cut the alert noise in 5 minutes?
Install our free slack app for AI investigation that reduce alert noise - ship with fewer 2 AM pings
Frequently Asked Questions
Everything you need to know about observability pipelines