

Missing from this list: an AI that actually fixes the issue →
Connect your tools and ask AI to solve it for you
Introduction to Database Monitoring Tools
In the fast-moving world of data management, database monitoring tools are a game changer. They're vital for keeping database environments healthy, high-performing, and reliable. Whether you're a database administrator (DBA) or part of an IT team, these tools give you the deep insights needed to fine-tune operations, avoid unexpected downtimes, and efficiently manage resources.
As businesses increasingly rely on real-time data processing and analytics, a sharp database monitoring strategy becomes critical for boosting operational efficiency and achieving better business results.
Database monitoring is about more than just keeping an eye on things. It involves actively tracking a variety of metrics and events within the database ecosystem, such as query performance, system health, resource usage, and transaction volumes. Using these tools, organizations can catch issues early, comply with regulations, and supercharge overall database performance to back up essential business functions.
How Database Monitoring Benefits Engineering Teams
Database monitoring tools are more than just a technical necessity; they are a powerhouse for engineering teams looking to keep their database systems robust, efficient, and scalable. Here's how these tools make a significant difference:
Real-time Performance Insights
Imagine having the ability to watch your database operations like a hawk 24/7. That's what these tools do. They provide ongoing monitoring, giving you a real-time look into key performance metrics such as query execution times, wait events, and I/O operations. This kind of immediate insight is priceless—it lets teams quickly spot bottlenecks and tweak SQL queries on the fly to keep everything running smoothly.
Proactive Issue Resolution
What if you could solve problems before they even happen? Many advanced monitoring tools use predictive analytics to do just that. They analyze past performance data to forecast potential future issues. This means teams can get a heads-up about patterns that could spell trouble, allowing them to take preventive measures early to dodge risks.
Automated Alerting and Reporting
Let's face it: no one enjoys the mundane parts of database management. That's where automation comes in. Database monitoring tools can take over the tedious task of tracking and reporting essential metrics. They can also send customizable alerts to flag any odd activities or performance dips, helping teams react swiftly to keep things under control and avoid major issues.
Integration with DevOps Practices
The best part? Many modern database monitoring tools are designed to gel seamlessly with the broader DevOps ecosystem. This integration fosters automated workflows, from database changes and performance tuning to capacity planning. It aligns database operations with agile development practices, making the process more fluid and responsive.
With these tools, engineering teams are not just fixing problems—they're preventing them and paving the way for a smoother, more efficient operational flow.
Popular Tools for Database Monitoring
In this section, we will explore some populat tools for database monitoring and they are listed below:
ManageEngine Applications Manager
Dynatrace
Datadog
SolarWinds Database Performance Analyzer
Prometheus
New Relic Database Monitoring
AppDynamics Database Monitoring
SQL Diagnostic Manager
Foglight for Databases
Redgate SQL Monitor
Tools
ManageEngine Applications Manager
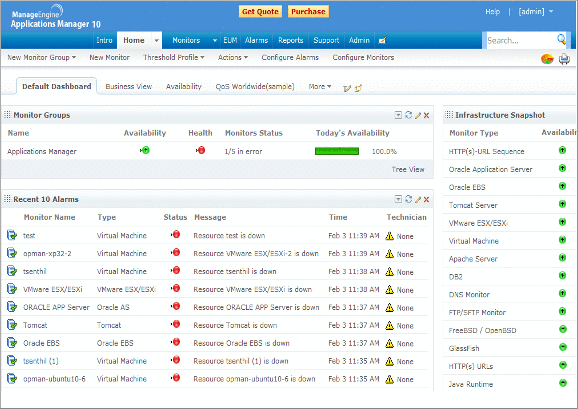
ManageEngine Applications Manager is a performance and IT infrastructure monitoring tool designed to address modern infrastructure challenges and ensure smooth operations for businesses and their users. It combines deep application performance monitoring with infrastructure, hybrid cloud, and digital experience monitoring, all accessible from a single platform. With its code-level insights, automation capabilities, and performance issue detection, IT and DevOps teams can streamline their processes and improve business outcomes. The tool helps businesses optimize application performance, reduce mean time to resolution (MTTR), enhance DevOps workflows, support cloud migration, and respond quickly to incidents, ensuring a seamless user experience.
Benefits
- Comprehensive monitoring of applications, servers, and databases with real-time diagnostics to minimize downtime.
- Intuitive user interface that simplifies navigation and enhances operational efficiency.
- Automation of routine monitoring tasks, allowing IT teams to focus on strategic initiatives.
- Cost-effective solution, suitable for both small and large businesses.
Considerations
- The user interface may occasionally face responsiveness issues, which can affect the overall user experience.
- The tool may generate a high volume of alerts, including false positives, which could lead to alert fatigue for IT staff.
Pricing
ManageEngine Applications Manager offers a range of pricing options based on the number of monitors and users. The Professional edition starts at $395 per year, while the Enterprise edition begins at $9,595 per year.
Relevant Links
GitHub: https://github.com/nasbench/ManageEngine-Application-Manager-XSS-POC
Dynatrace.
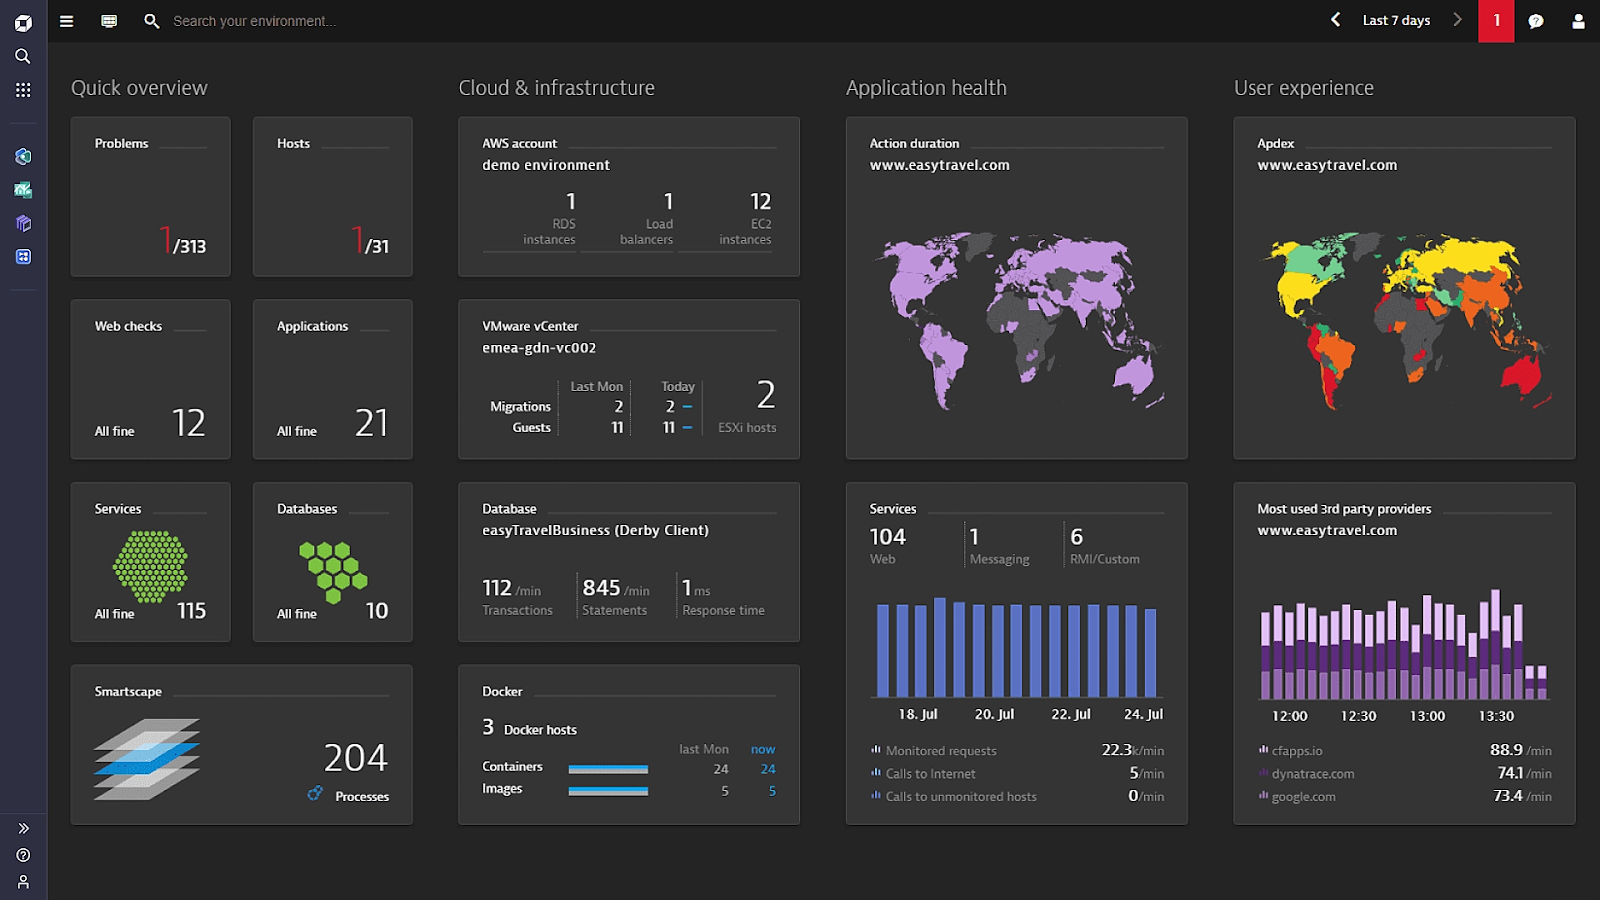
Dynatrace (NYSE: DT) aims to ensure that software operates flawlessly. Our integrated platform merges extensive observability and ongoing runtime application security with Davis® hypermodal AI, delivering insights and intelligent automation from vast amounts of data. This empowers innovators to upgrade and streamline cloud operations, release software more quickly and securely, and guarantee seamless digital experiences. This is why leading global organizations rely on the Dynatrace® platform to speed up their digital transformation efforts.
Benefits
- Its user-friendly interface and extensive range of features.
- Offer a comprehensive, holistic view of our complete application environment.
Considerations
- Dynatrace's pricing may be considered relatively high, particularly for smaller teams or businesses that are just beginning.
G2 Ratings: 4.5

Pricing
Dynatrace offers flexible pricing plans tailored to meet the needs of businesses of all sizes, ensuring comprehensive monitoring and performance management for your applications.
Relevant Links
Release Notes-: https://docs.dynatrace.com/docs/whats-new/release-notes
Datadog
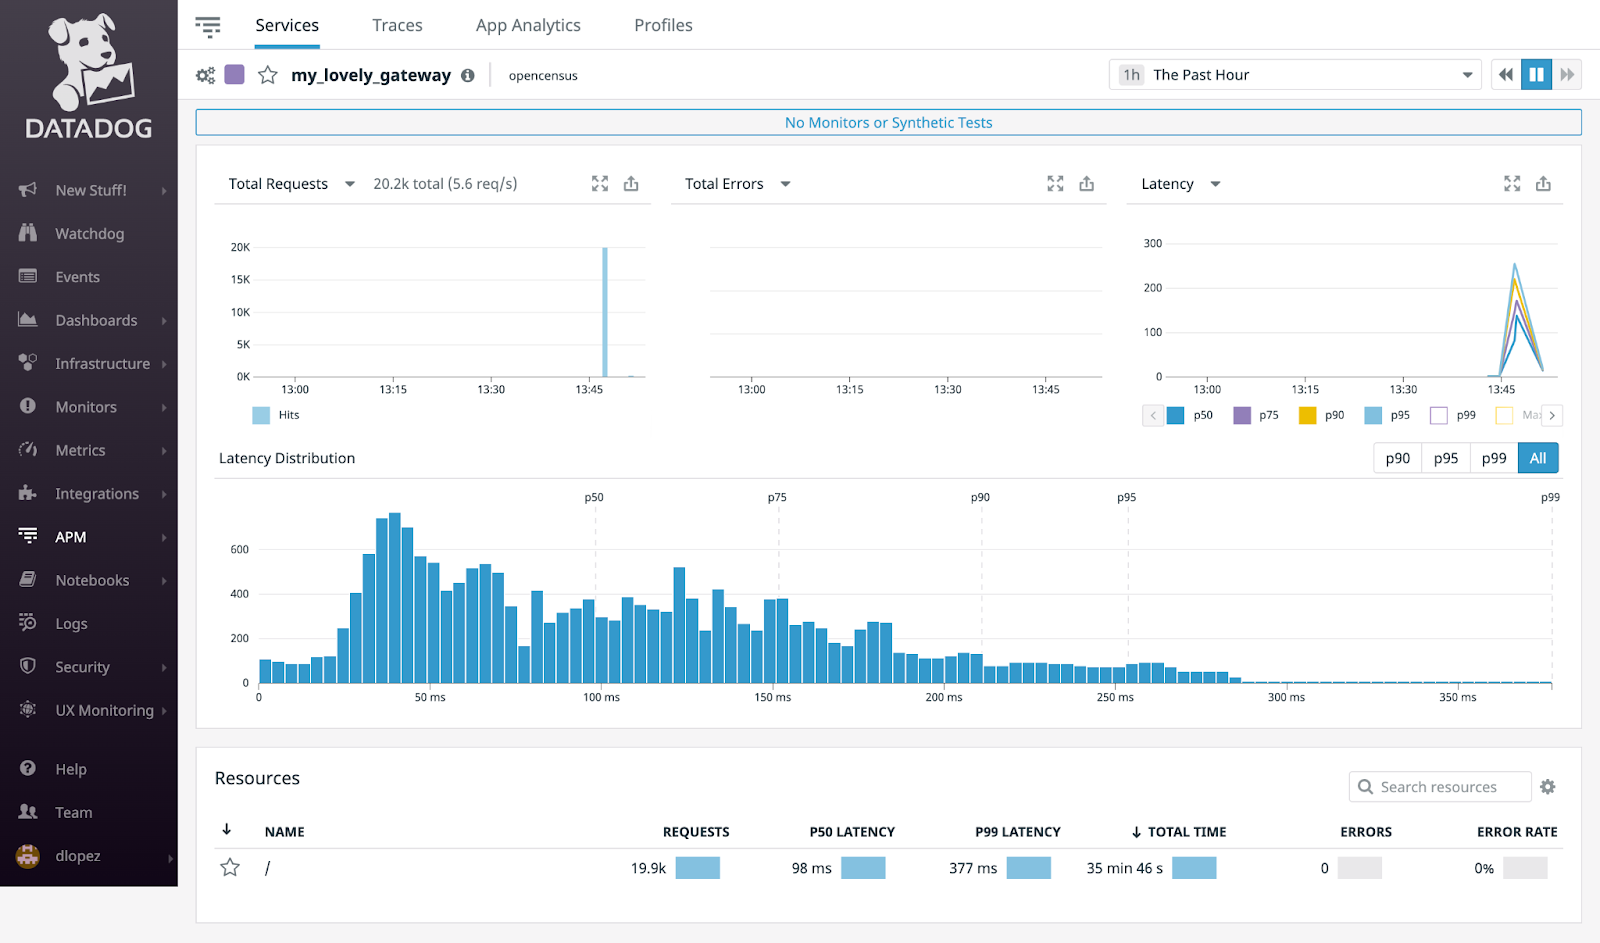
Datadog is a monitoring, security, and analytics platform designed for developers, IT operations teams, security engineers, and business users in the cloud era. This SaaS platform seamlessly integrates and automates infrastructure monitoring, application performance monitoring, and log management, delivering unified, real-time visibility into its customers' entire technology stack. Organizations of all sizes and across various industries utilize Datadog to facilitate digital transformation and cloud migration, foster collaboration among development, operations, security, and business teams, expedite application time to market, decrease problem resolution time, secure applications and infrastructure, analyze user behavior, and monitor essential business metrics.
Benefits
- Finding and fixing bugs before users encounter them is a significant advantage.
- Datadog offers numerous useful features and integrations for applications, including metrics and monitoring.
- It provides customizable dashboards.
- Supports cost optimization.
Considerations
- The setup documentation can be somewhat challenging to comprehend.
G2 Rating: 4.3

Pricing
Datadog offers a variety of pricing plans, starting at $15/month, designed to accommodate the needs of different teams and organizations and ensure comprehensive monitoring and analytics solutions.
Relevant Links
Docs: https://docs.datadoghq.com/
SolarWinds Database Performance Analyzer.
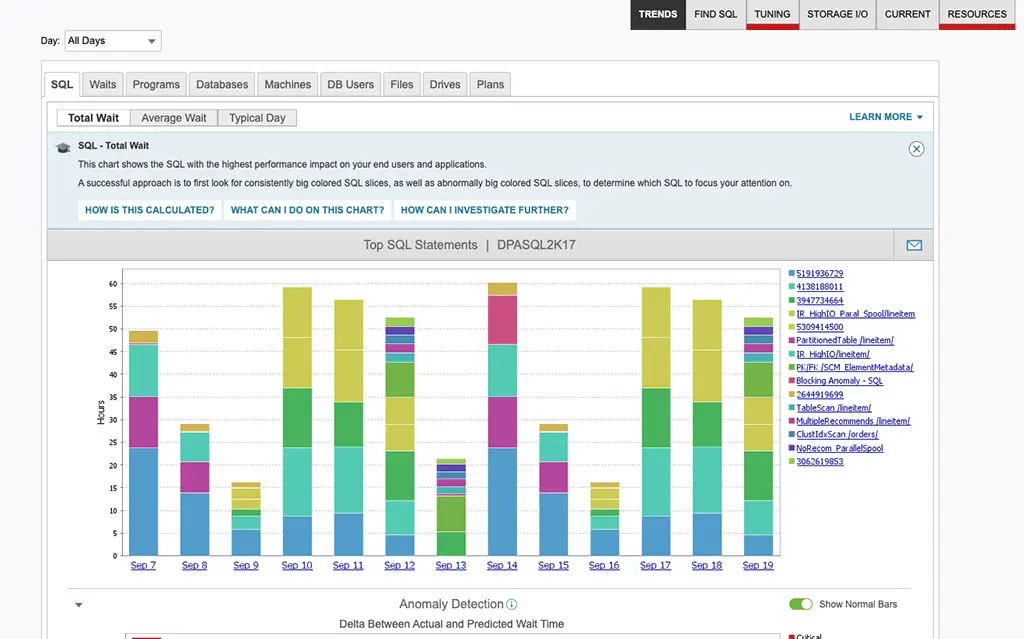
This cross-platform solution monitors database performance for both cloud and on-premises databases. With machine learning-driven anomaly detection and in-depth wait-time analysis, you can diagnose performance issues in minutes rather than days. Access to both real-time and historical data provides precise answers to address critical problems, while expert guidance through query and table-tuning advisors enables proactive optimization of your enterprise.
Benefits
- A simple setup process using a command line and PowerShell module allows for easy target addition and management, with conditions that can be directly exported.
- Includes tools for quickly identifying the root cause of issues by maintaining a history of events.
- Features an excellent alert system to notify users of any problems.
- Outstanding customer support, with helpful personnel readily available for assistance.
Considerations
There is potential for enhancing performance monitoring. At times, accessing top SQL can be challenging due to the complexities of the GUI.
G2 Rating: 4.5

Pricing
SolarWinds Database Performance Analyzer offers flexible pricing options tailored to meet the diverse needs of organizations seeking effective database monitoring and performance optimization solutions.
Relevant Links
Documentation: https://documentation.solarwinds.com/
Community: https://thwack.solarwinds.com/
GitHub: https://gist.github.com/james-otten/d3ee2f0fccc3b87aafe1616a6c2c2d4e
Prometheus.
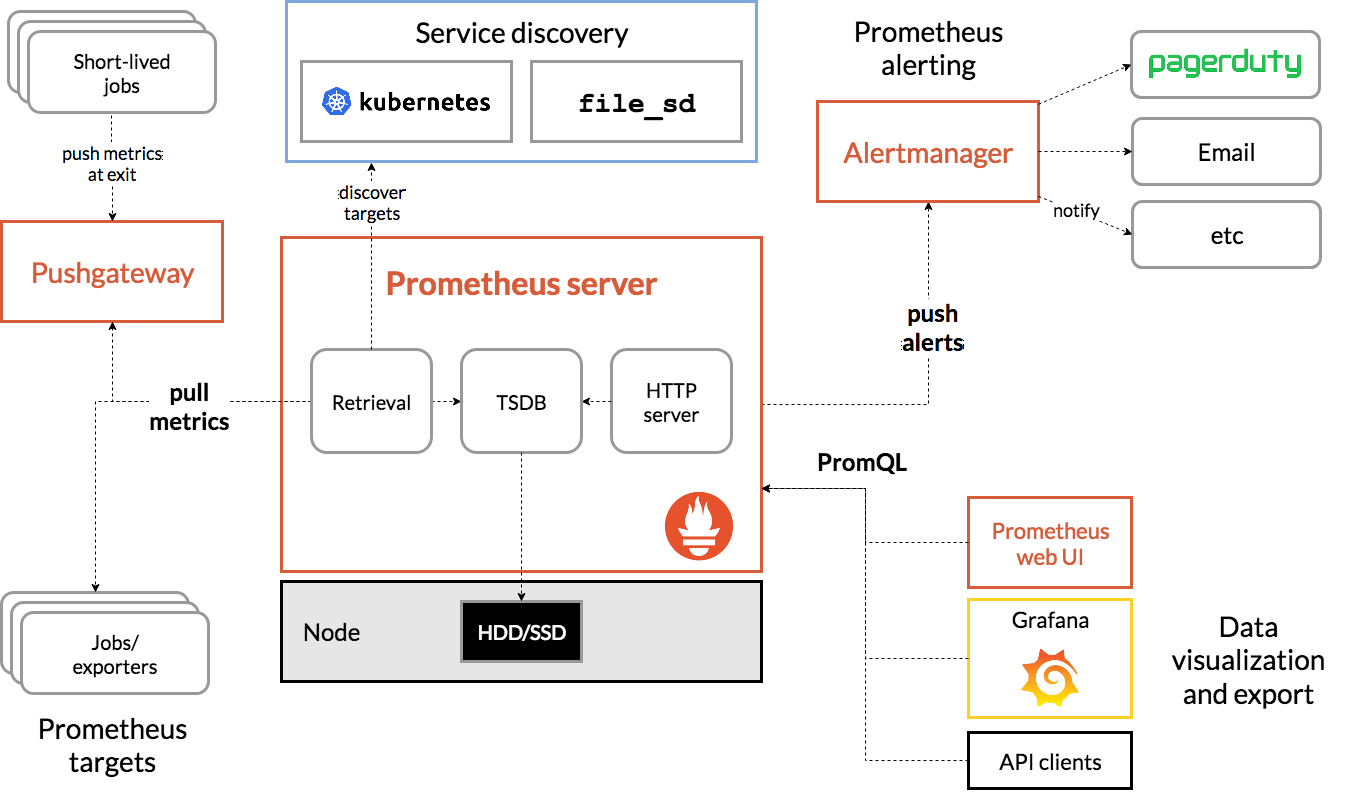
An open-source monitoring system featuring a dimensional data model, a versatile query language, an efficient time series database, and a contemporary alerting method.
Benefits
- It can gather various metrics from multiple applications simultaneously and provides customizable alerts based on the collected data to suit user preferences.
- Additionally, it offers strong support for Kubernetes infrastructure and is completely free to use.
Considerations
- Troubleshooting high memory usage can be challenging.
- Update processes tend to be slow, leading to delays in improvements.
G2 Ratings: 4.4

Pricing
Prometheus is 100% open-source and community-driven
Relevant Links
Community: https://prometheus.io/community/
New Relic Database Monitoring
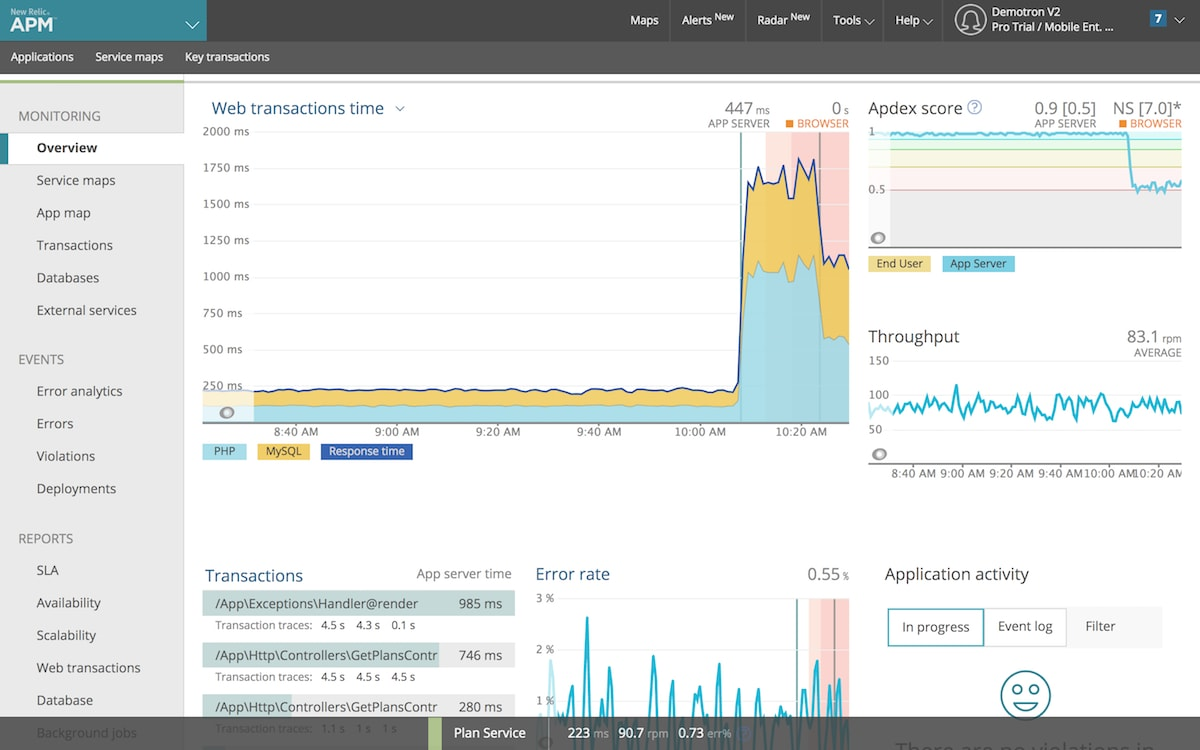
New Relic pioneered cloud APM for application engineers and is now a leader in observability. It serves as a trusted source of data-driven decision-making for engineers throughout the software stack and lifecycle. With around 25 million engineers worldwide spanning over 25 roles, New Relic empowers them to gain real-time insights and track performance trends, helping businesses become more resilient and deliver exceptional customer experiences.
Benefits
- It provides users with a comprehensive view of application performance, enabling proactive identification and resolution of issues before they escalate.
- The customizable dashboards and alerting features make it easy to monitor key metrics and stay in control of your system's health.
Considerations
- For beginners, the platform can be challenging to learn, as navigating the wide range of tools and metrics available may feel overwhelming.
G2 Ratings: 4.3

Pricing
New Relic offers flexible pricing plans, including a free tier and pay-as-you-go options, allowing users to scale according to their monitoring and observability needs.
Relevant Links
Docs: https://docs.newrelic.com/
Community: https://newrelic.com/blog/authors/new-relic-community-team
GitHub: https://opensource.newrelic.com/projects/newrelic/nr1-github
AppDynamics Database Monitoring
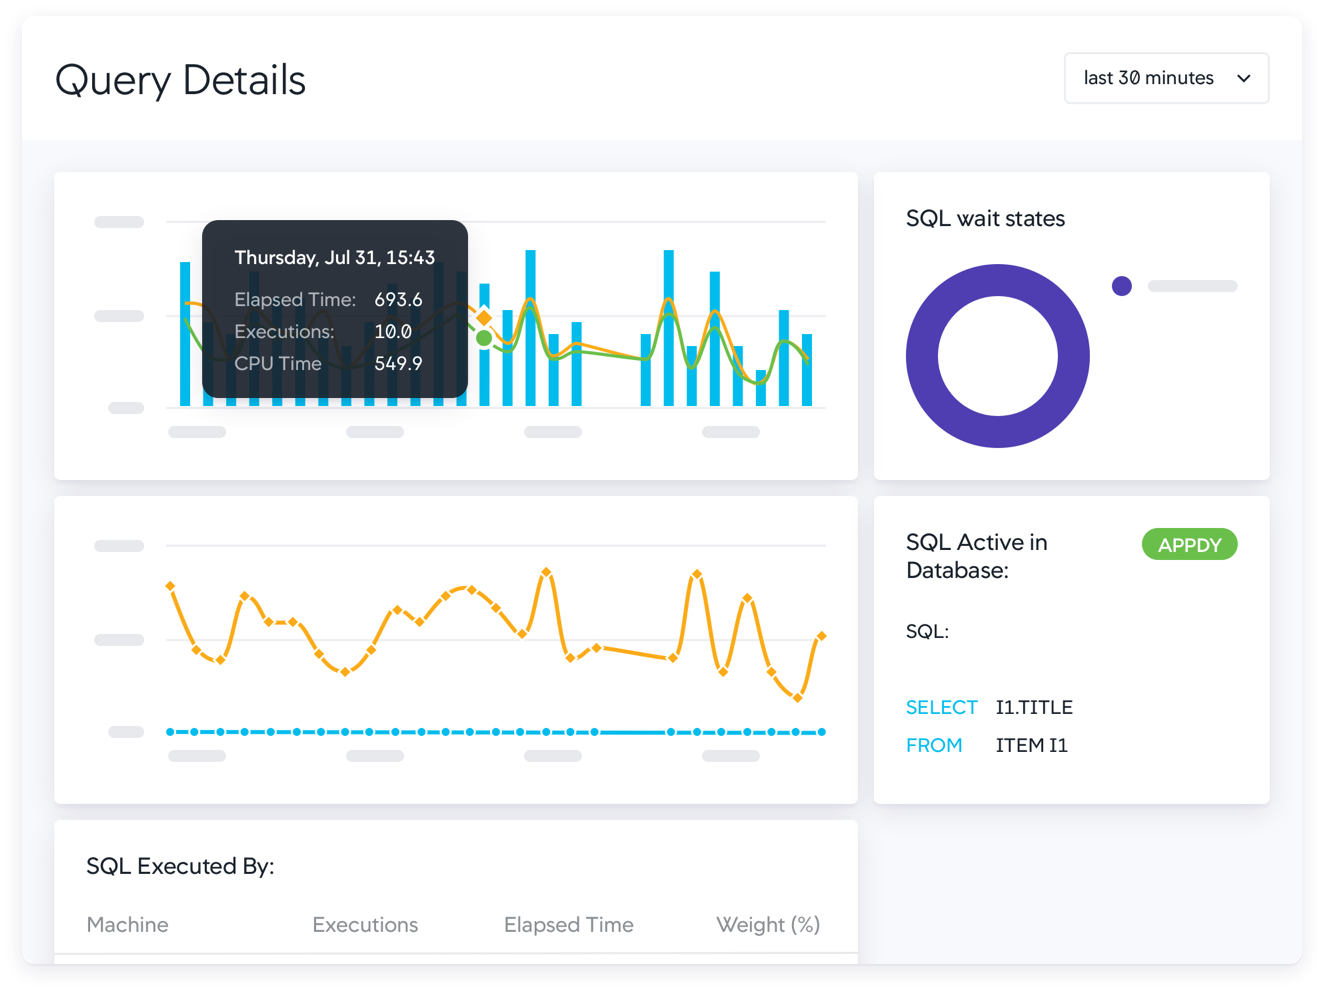
Backed by Cisco, AppDynamics is dedicated to helping companies view their technology from a business perspective, enabling them to unite and focus on what truly matters. We are revolutionizing the observability landscape and streamlining the complexities of digital transformation for the world’s largest enterprises. The AppDynamics Business Observability Platform accelerates organizational transformation by offering deep business insights across the technology stack, aligning teams with common goals, and empowering technologists to take decisive, confident action.
Benefits
- AppDynamics is a highly versatile tool that integrates seamlessly with a wide range of third-party services, including SaaS, cloud platforms, and other data monitoring tools.
- It excels in identifying and monitoring problematic transactions, helping to boost business productivity.
- Additionally, configuring servers, analytics, metrics, and alerts is straightforward, making it an efficient solution for monitoring and performance management.
Considerations
- The costs can be quite high for larger organizations.
- Competitors offer similar services at more competitive pricing.
G2 Rating: 4.3

Pricing
AppDynamics offers flexible pricing options tailored to meet the needs of businesses of all sizes, with customized plans available to match specific performance monitoring and management requirements.
Relevant Links
Resources: https://www.appdynamics.com/resources
SQL Diagnostic Manager.
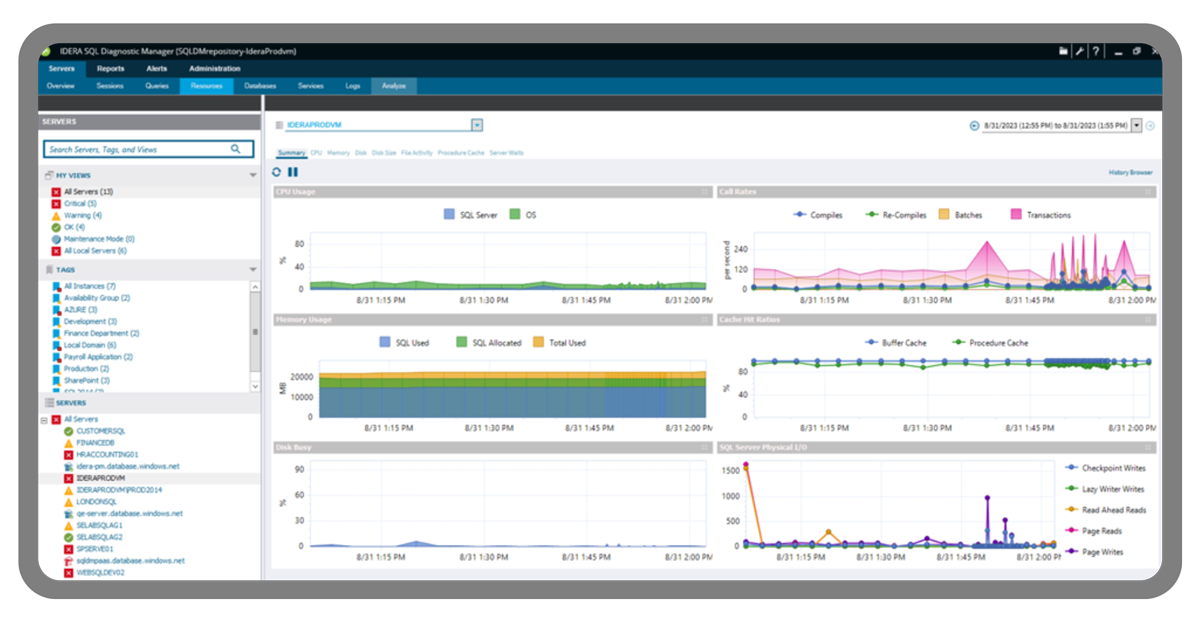
Decreased availability and performance of SQL Server can significantly affect the vital applications it supports. SQL Diagnostic Manager for SQL Server offers comprehensive monitoring, covering the entire SQL Server environment and delivering the most detailed diagnostics available. It monitors physical, virtual, and cloud environments, tracks queries and plans to resolve blocks and locks, provides predictive alerts to minimize false notifications, and includes expert advice with actionable scripts.
Benefits
- Easy to install and configure
- Users like query optimization
- Detailed descriptions of the query
Considerations
- The initial setup is time-consuming.
G2 Rating: 4

Pricing
SQL Diagnostic Manager offers flexible pricing plans, allowing businesses to choose the option that best fits their SQL Server monitoring and management needs.
Relevant Links
Foglight for Databases.
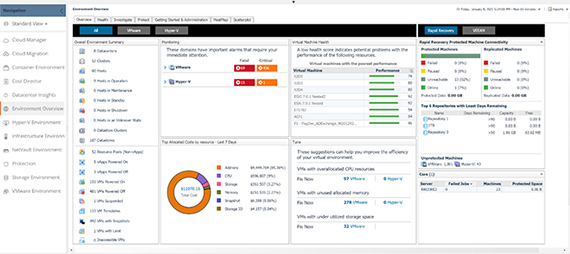
Quest's Foglight for Databases provides a comprehensive solution for database monitoring, seamlessly integrating performance tracking across various platforms, whether cloud-based or on-premises. It supports relational, non-relational, open-source, and cloud-exclusive databases. With advanced diagnostic tools, organizations can actively manage and optimize both real-time and historical performance, troubleshoot issues, and improve the overall health of their database environment.
Benefits
- Navigating the environment overview provides a quick and convenient summary of the activity across hosts and clusters, making it easier to monitor the system.
- The Alarm module is highly effective, offering detailed reports on the status of physical disks.
Considerations
- The Foglight application server is resource-intensive and consumes significant memory. Therefore, if you plan to host it on-premises, you must account for the additional hardware costs required to support its performance.
G2 Ratings: 4

Pricing
For detailed pricing information on Foglight for Cross-Platform Databases, visit the official Quest page here, as it offers customized pricing plans.
Relevant Links
Redgate SQL Monitor
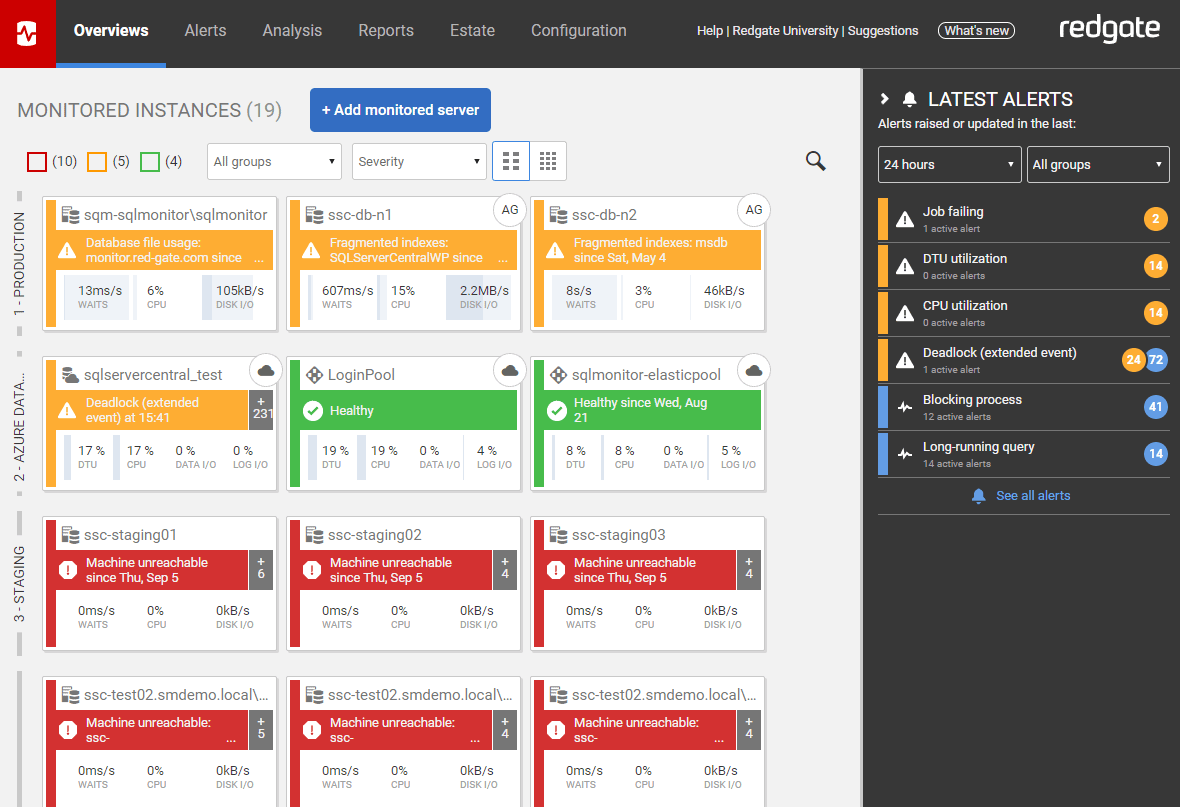
Redgate designs innovative, user-friendly software to help data professionals maximize the value of any database through comprehensive Database DevOps solutions. Trusted by over 200,000 users worldwide, including 92% of Fortune 100 companies, Redgate delivers simple yet powerful tools. Redgate Monitor allows you to oversee your entire database ecosystem from a unified dashboard. It enables proactive risk management with instant issue diagnosis and customizable alerts, regardless of where your databases are hosted. Say goodbye to downtime, customer complaints, and 3 am wake-up calls.
Benefits
- The platform provides a user-friendly interface with real-time dashboards and intuitive navigation, making management easier.
- A highly customizable alerting system delivers timely notifications about performance issues or potential bottlenecks, helping save time and prevent escalation.
- Clear, actionable performance reports with visual insights simplify troubleshooting and are supported by comprehensive reference documentation.
- The installation process is straightforward and well-supported.
- Adding or removing servers from the monitoring dashboard is quick and hassle-free.
Considerations
- The update installation process could be refined to match the product's overall high-quality experience.
G2 Ratings: 4.4

Pricing
Redgate Monitor pricing starts at $1,495 per year, offering flexible options based on the number of servers monitored.
Relevant Links
Docs: https://www.red-gate.com/products/redgate-monitor/resources/
Conclusion
Choosing the right database monitoring tool is crucial for maintaining database environments' performance, availability, and security. Each tool listed offers unique features and capabilities, so organizations must consider their specific needs and constraints when selecting a solution.
Whether the priority is deep diagnostic capabilities, real-time performance monitoring, or cost-effectiveness, the range of options available ensures that there is a tool to meet every requirement.
Missing from this list: an AI that actually fixes the issue →
Connect your tools and ask AI to solve it for you
Ready to cut the alert noise in 5 minutes?
Install our free slack app for AI investigation that reduce alert noise - ship with fewer 2 AM pings
Frequently Asked Questions
Everything you need to know about observability pipelines