

Missing from this list: an AI that actually fixes the issue →
Connect your tools and ask AI to solve it for you
Introduction to Guide for creating alerts in Prometheus Alert Manager
Prometheus Alert Manager is a powerful tool designed to monitor systems and alert teams about potential issues before they become critical. As organizations increasingly rely on complex systems, having a reliable alerting mechanism is crucial to maintaining uptime and ensuring smooth operations.
Prometheus, combined with its Alert Manager, offers a robust solution for defining, managing, and routing alerts based on real-time metrics. This guide walks you through the essentials of creating and managing alerts in Prometheus Alert Manager.
This comprehensive guide will equip you with the knowledge to effectively implement alerts tailored to your infrastructure, from understanding key terminologies and writing alerting rules to setting up advanced configurations and best practices.
Whether you’re new to Prometheus or looking to refine your alerting strategy, this guide has you covered.
Let’s explore how to set up and manage alerts in Prometheus Alert Manager to keep your systems running smoothly!
Need a head start? Grab our production-ready alert templates on GitHub: https://github.com/DrDroidLab/prometheus-alert-templates. Fork the repo, drop the YAML files into rule_files, and tweak labels to match your environment.
Key Terminologies in Prometheus
Before diving into setting up alerts, it’s essential to familiarize yourself with the core concepts that form the foundation of Prometheus monitoring and alerting.
- Metric: A piece of data tracked over time, representing system performance or behavior, such as CPU usage or memory consumption. Metrics are the building blocks of monitoring in Prometheus.
- PromQL (Prometheus Query Language): A flexible query language used in Prometheus to retrieve and manipulate metrics for analysis, visualization, and alerting.
- Alerting Rules: Predefined conditions in Prometheus that specify when an alert should be triggered based on metric thresholds or anomalies.
- Alert States:Pending: The state when alert conditions are initially met but have not persisted long enough to trigger an alert.Firing: The state when an alert is actively triggered and sent to the Alertmanager.Resolved: The state when alert conditions are no longer met and the alert is cleared.
- Alertmanager: A companion component to Prometheus that handles alerts by grouping, silencing, deduplicating, and routing them to appropriate receivers like Slack, email, or PagerDuty.
These key terms provide the foundation for understanding and utilizing Prometheus effectively for monitoring and alerting.
For more information, visit- https://prometheus.io/docs/introduction/glossary/
Creating Prometheus Alert Rules and Lifecycle
Understanding the Alerting Lifecycle
The Prometheus alert lifecycle covers the complete progression of an alert, starting from when Prometheus gathers data to the final step of delivering a notification to your team.
This journey includes several crucial stages:
- Pending: Alerts enter this state when specified conditions are met for the first time.
- Firing: After the specified duration (e.g., 5 minutes) of conditions persisting, the alert transitions to the Firing state and sends notifications.
- Resolved: Once the conditions are no longer met, the alert moves to the Resolved state, clearing the notification.
Setting Up Alerting Rules
- Prometheus alerting rules are defined in the prometheus.yml configuration file.
- Rules specify conditions for firing alerts using PromQL expressions.
Example of a CPU usage alert rule:
Reloading Prometheus Configurations
- After adding or modifying alerting rules, Prometheus requires a configuration reload to apply changes.
- This can be done by sending a SIGHUP signal to the Prometheus process or using the HTTP API endpoint /-/reload.
These steps ensure you can effectively define and manage alerting rules in Prometheus for proactive monitoring.
To know more about the alerting rules, visit: https://prometheus.io/docs/prometheus/latest/configuration/alerting_rules/
Advanced Functionalities
Prometheus Alert Manager offers advanced capabilities that go beyond basic alerting, enabling users to customize notifications, configure sophisticated conditions, and integrate seamlessly with other tools.
Below are the key functionalities to enhance your alerting strategy:
Prometheus Alert Manager offers advanced capabilities that go beyond basic alerting, enabling users to customize notifications, configure sophisticated conditions, and integrate seamlessly with other tools.
Below are the key functionalities to enhance your alerting strategy:
Prometheus Alert Manager APIs
- Provides two APIs (v1 and v2) for interacting with Alertmanager.
- Allows pushing alerts via POST requests with defined labels and annotations.
- Enables managing alert states (startsAt, endsAt) for better control of overactive alerts.
- Supports integration with third-party systems for automated workflows.
Templates in Prometheus Alert Manager
- Enables customization of alert notifications for receivers like Slack, email, or webhooks.
- Supports dynamic variables (e.g., {{ $labels.instance }}, {{ $annotations.description }}) to make alerts more informative.
- Example: Format Slack alerts to highlight severity, instance details, and resolution steps.
Configuring Prometheus Alert for Down Targets
- Alerts for down targets help monitor non-responsive instances effectively.
- Use the up metric in PromQL to define rules:

- Ensures immediate notification when monitored targets become unreachable.
Combining Multiple Conditions in Prometheus Alert Rules
- Combines conditions using logical operators (AND, OR, UNLESS) to refine alert accuracy.
Example: High CPU usage combined with low memory availability:

- Reduces notification noise by triggering alerts only when multiple critical conditions are met.
These advanced features make Prometheus Alert Manager a robust tool for precise and efficient alerting.
Grouping and Routing Alerts in Alertmanager
Managing alerts efficiently is critical for avoiding alert fatigue and ensuring the right people are notified at the right time. Prometheus Alertmanager provides functionalities like grouping and routing to make alerting more actionable and less overwhelming.
Grouping Alerts
- Alerts can be grouped based on shared labels, such as severity or instance, to minimize notification noise.
- Grouping helps consolidate multiple related alerts into a single notification, making it easier to identify and resolve issues.
Example: Grouping alerts by severity and instance for better organization:

Routing Alerts
- Routing ensures alerts are delivered to the correct receiver based on predefined rules in alertmanager.yml.
- Alerts can be routed differently based on their criticality or source, improving response efficiency.
Example: Routing critical alerts to Slack and non-critical alerts to email:

Setting up Notifications in Alertmanager
Alertmanager provides flexible options for sending notifications to various platforms, ensuring that alerts reach the right teams promptly. Below are the key notification methods and examples of how to configure them.
Notification Receivers
- Alerts can be sent to different receivers, including Slack, email, or webhook endpoints.
- Receiver types are configured in the alertmanager.yml file with specific parameters for each channel.
Slack Notification Configuration
- Slack is commonly used to send real-time alert notifications to teams.
Example Configuration

Email Configuration
- Email is a reliable method for alerting, especially for non-critical or routine notifications.
Example SMTP configuration:

- Customize the email address, SMTP server, and credentials to match your setup.
Webhook Configuration
- Webhooks allow alerts to be sent to internal systems or third-party services for further processing.
Example configuration:

- Replace http://your-system.com/api/alerts with the URL of your webhook endpoint.
By configuring these notification methods, Alertmanager ensures that alerts are delivered reliably to the right recipients through preferred channels.
Handling Silences and No Data Alerts
Alertmanager offers mechanisms to manage alerts during maintenance or unexpected data gaps, ensuring notifications remain relevant and actionable.
Silencing Alerts
- Silences temporarily mute alerts to prevent unnecessary notifications during known downtimes or maintenance periods.
- Silences can be configured using matchers based on specific labels (e.g., severity, instance).
Example configuration for silencing alerts for a specific time range

- Silences can also be managed via the Alertmanager web UI for greater convenience.
No Data Alerts
- No data alerts help identify when Prometheus fails to collect data for a metric, indicating potential issues with the system.
- These alerts are crucial for detecting gaps in monitoring coverage.
Example configuration for a missing metric alert:

Best Practices for Creating Alerts
Effective alerts are essential for proactive monitoring, but poorly configured alerts can lead to noise and inefficiencies. Following best practices ensures your alerts are meaningful and actionable.
Use the Doctor Droid Alerting Bot
- Leverage Doctor Droid to reduce alert noise by filtering unnecessary notifications and prioritizing critical issues.
- Automate alert analysis and resolution steps using Doctor Droid Playbooks for faster incident management.

Meaningful Thresholds
- Set thresholds that reflect real operational risks to avoid false positives.
- Fine-tune values based on historical data to ensure thresholds align with system performance.
Avoid Alert Fatigue
- Group-related alerts are used to reduce the volume of notifications and make them more actionable.
- Define clear conditions for triggering alerts to avoid overwhelming teams with unnecessary notifications.
Combine Multiple Conditions
- Use logical operators to create alerts that combine multiple metrics for increased accuracy.
- Example: High CPU usage combined with low memory availability provides a clearer signal of resource strain.
Tune Alert Timing
- Use for durations in alert configurations to ensure only persistent issues trigger alerts, avoiding spikes and transient anomalies.
- Example: An alert for high CPU usage that lasts more than 10 minutes reduces noise from short-term fluctuations.
By adhering to these practices, you can design alerts that are precise, meaningful, and help your team focus on resolving critical issues efficiently.
Examples
Here are practical examples of how to use Prometheus Alertmanager to monitor critical scenarios in Kubernetes environments and track high resource usage effectively.
Monitoring and Alerting for Pod Restart in Kubernetes using Prometheus
- Use the kube_pod_container_status_restarts_total metric to monitor pod restarts.
Example alert rule

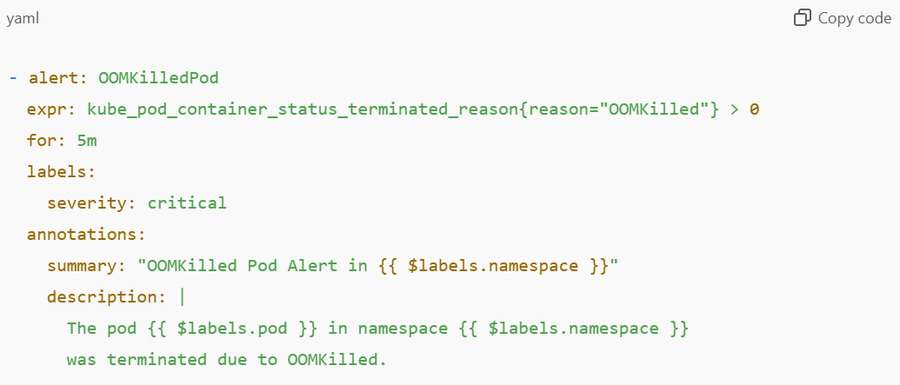
Setting up Alerts for OOMKilled in Kubernetes using Prometheus
- Track pods terminated due to Out Of Memory (OOM) using the kube_pod_container_status_terminated_reason metric.
Example alert rule:
Prometheus Alerts for Kubernetes Pods in CrashLoopBackOff
- Monitor pods stuck in the CrashLoopBackOff state using the kube_pod_container_status_waiting_reason metric.
Example alert rule

Setting Up Prometheus High CPU Usage Alert Rules
- Monitor instances with high CPU usage using the node_cpu_seconds_total metric.
Example alert rule

Conclusion
Prometheus Alert Manager is an indispensable tool for maintaining system reliability and ensuring teams are notified promptly about critical issues. By understanding key concepts, leveraging advanced functionalities, and following best practices, you can build a robust alerting strategy tailored to your infrastructure’s needs.
From setting up simple alerting rules to integrating advanced features like grouping, routing, and silencing, this guide equips you with everything you need to optimize your monitoring setup.
Whether you're dealing with Kubernetes pod issues, tracking resource usage, or managing high-volume alerts, Prometheus and its Alert Manager provide the flexibility and scalability required to stay ahead of potential disruptions.
For organizations seeking to further reduce alert fatigue and streamline incident resolution, tools like Doctor Droid Alerting Bot can complement Prometheus by filtering unnecessary notifications, prioritizing critical issues, and automating workflows. By integrating Doctor Droid into your alerting system, you can enhance efficiency and empower your team to focus on what truly matters.
Start optimizing your alerting process today and ensure your systems remain resilient, efficient, and ready to handle whatever challenges come their way.
🚀 Quick-start templatesSave setup time with our open-sourced Prometheus alert templates→https://github.com/DrDroidLab/prometheus-alert-templates
Appendix: Additional Resources and Tools
- Prometheus Alert Templates by Dr. Droid
Github Link - Official DocumentationPrometheus Official DocumentationAlertmanager Documentation
- Grafana IntegrationsSetting up Prometheus with GrafanaGrafana Alerting Guide
- Slack IntegrationsConfiguring Slack Notifications in Alertmanager
- Webhook ExamplesSetting up Webhooks in Prometheus
- Kubernetes Monitoring and AlertingPrometheus Monitoring in KubernetesPrometheus Operator Documentation
- Additional ToolsDoctor Droid Alerting Bot
Missing from this list: an AI that actually fixes the issue →
Connect your tools and ask AI to solve it for you
Ready to cut the alert noise in 5 minutes?
Install our free slack app for AI investigation that reduce alert noise - ship with fewer 2 AM pings
Frequently Asked Questions
Everything you need to know about observability pipelines