

Missing from this list: an AI that actually fixes the issue →
Connect your tools and ask AI to solve it for you
Introduction to RabbitMQ Monitoring and Alerting
RabbitMQ is a widely used message broker that enables asynchronous communication between systems. It manages the delivery of messages between producers and consumers, ensuring they are processed orderly. It also provides a reliable messaging infrastructure for distributed systems, microservices, and applications, supporting various messaging patterns like queues, exchanges, and routing.
Monitoring RabbitMQ is essential for ensuring the reliability of message delivery, system performance, and scalability. By tracking key metrics and setting up alerts, you can detect and resolve bottlenecks in real time before they cause disruptions. Proactive monitoring helps identify issues such as high message queue lengths, slow consumers, or failed message deliveries, ensuring the smooth operation of your messaging infrastructure.

Want to learn how to use RabbitMQ? Here is a detailed guide.
Key Metrics to Monitor in RabbitMQ
Monitoring RabbitMQ involves tracking various metrics to ensure optimal performance, resource utilization, health, and error detection. Below are the key metrics you should monitor to maintain a healthy and efficient messaging system.
Performance Metrics
These metrics focus on the overall performance of RabbitMQ, identifying potential slowdowns or issues in message delivery and processing.
1. Message Rates
Track the published, delivered, and acknowledged message rates to monitor the flow of messages through RabbitMQ. A sudden drop or delay in these rates can signal backlogs or issues in message processing, affecting system performance. Monitoring these rates helps identify and resolve delays before they impact message delivery.
2. Queue Lengths
Monitoring the number of messages in queues is crucial for detecting congestion. Lengthy queues often indicate that consumers cannot process messages fast enough, which can cause delays. By tracking queue lengths, you can take action, such as scaling consumers or adjusting processing rates, to prevent message processing bottlenecks.
3. Consumer Performance
Track consumer acknowledgments and message processing times to ensure consumers efficiently handle messages. Slow or unacknowledged messages can point to processing delays or resource issues. Monitoring this metric lets you quickly identify which consumers are struggling and need optimization or scaling.
Resource Utilization
Resource utilization metrics help ensure that RabbitMQ has the necessary resources to process messages efficiently without overloading your system.
1. CPU and Memory Usage
High CPU or memory usage can indicate processing bottlenecks or memory leaks in your RabbitMQ system. If usage remains consistently high, it could point to inefficiencies in message handling or the need for additional resources. Regular monitoring allows you to adjust resources accordingly to avoid slowdowns.
2. Disk Space
Monitoring disk space usage is critical, especially when dealing with persistent messages. If disk space is running low, it can result in message delivery failures or RabbitMQ crashes. Ensuring you have enough disk space for persistent messages helps maintain data integrity and prevents disruptions.
3. Network Throughput
Sufficient network bandwidth is essential for handling high message rates. Monitoring network throughput ensures the system can process messages efficiently without bottlenecks or delays due to limited bandwidth. A drop in throughput could indicate network congestion or issues that need to be resolved to maintain smooth communication between nodes.
Health and Availability Metrics
These metrics track the overall health of RabbitMQ nodes and connections, ensuring system availability and cluster consistency.
1. Node Status
Monitor the health of RabbitMQ nodes within the cluster to ensure they are running correctly. If a node becomes unresponsive or fails, it can affect the availability and reliability of the entire system. Regularly checking node status allows you to take preventive action before it causes issues in your RabbitMQ environment.
2. Cluster Partitioning
Cluster partitioning occurs when network splits prevent nodes from communicating, affecting message delivery and consistency. Detecting partitioning issues early ensures that your cluster remains consistent and operational. Timely detection of network splits can prevent data inconsistency and message delivery failures.
3. Connection Status
Monitor active connections and connection failures to ensure clients can reliably connect to RabbitMQ. A high number of failed connections could indicate network or authentication issues. By tracking this metric, you can quickly identify and resolve problems that may affect the availability of your messaging system.
Error Metrics
Error metrics help identify problems with message processing, routing, and connections, enabling you to act quickly to prevent disruptions.
1. Message Rejections
Track messages rejected by consumers or RabbitMQ policies. Rejections can occur for various reasons, such as message size limits or incorrect routing. Monitoring this metric helps you identify why messages are being rejected and allow you to adjust configurations or retry failed messages to ensure successful processing.
2. Unroutable Messages
Unroutable messages occur when messages fail to reach any queue. This could happen if there's no matching binding or the routing key is incorrect. By monitoring this metric, you can identify when messages are not being appropriately routed and take action to fix routing configurations or bindings.
3. Channel and Connection Errors
Frequent disconnects or misconfigurations in channels and connections can cause instability in your RabbitMQ environment. Monitoring these errors helps you identify potential configuration issues or network instability affecting your system's reliability. Addressing these errors promptly ensures continuous communication between producers and consumers.
By monitoring these key metrics, you can ensure that your RabbitMQ system remains efficient, reliable, and scalable, allowing you to address issues proactively before they impact system performance.
Setting Up Monitoring for RabbitMQ
Effective monitoring for RabbitMQ requires the proper setup to track performance, health, and message delivery. You can use RabbitMQ's built-in tools or integrate third-party solutions to enhance visibility and streamline alerting. Below are the methods to set up monitoring for RabbitMQ.
Using RabbitMQ Management Interface
RabbitMQ provides a built-in management UI that allows you to monitor queues, exchanges, and nodes in real time. This interface lets you view key metrics such as message rates, queue lengths, and consumer activity. It provides a simple yet effective way to track RabbitMQ's performance, identify potential issues, and manage your messaging infrastructure from a centralized dashboard.

Integrating Third-Party Monitoring Tools
While RabbitMQ's built-in tools are helpful, third-party monitoring solutions offer additional in-depth monitoring and alerting features.
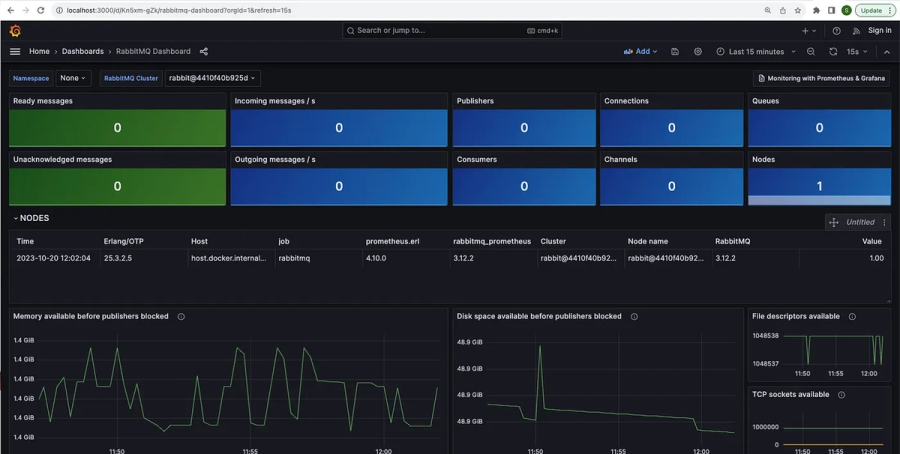
1. Prometheus and Grafana
Set up the RabbitMQ Exporter for Prometheus to scrape relevant metrics from RabbitMQ. Prometheus collects time-series data, which can then be visualized in Grafana dashboards. This setup offers powerful, customizable monitoring and alerting capabilities for real-time tracking of RabbitMQ's health and performance.

Also read: Mastering Grafana Alerting: Key Terminologies and Notification Policies
2. Datadog and New Relic
For advanced monitoring and alerting, integrate RabbitMQ with Datadog or New Relic. These platforms offer deep visibility into your RabbitMQ environment with custom dashboards and proactive alerts. They provide detailed insights into system performance, helping you detect issues early and respond quickly to prevent disruptions.


3. ELK Stack
Use the ELK Stack (Elasticsearch, Logstash, and Kibana) for log-based RabbitMQ monitoring. Elasticsearch stores and indexes logs, Logstash processes and filters them, and Kibana visualizes the data. This setup lets you track RabbitMQ logs in real-time, helping you identify errors, anomalies, and performance issues in a centralized logging system.
These tools can enhance your RabbitMQ monitoring, ensuring reliable message delivery and proactive system management.
Stay ahead of performance issues by monitoring RabbitMQ effectively. Get started with Doctor Droid to enhance your alerting workflow and reduce noise.
Best Practices for RabbitMQ Monitoring
To ensure optimal RabbitMQ performance and reliability, it's essential to follow best practices focusing on monitoring key metrics, defining thresholds, and identifying potential issues early. Below are the best practices for effectively monitoring your RabbitMQ environment.
1. Monitor Critical Metrics
Prioritize monitoring key metrics like queue lengths, message rates, and consumer performance. These metrics are essential for understanding RabbitMQ's health and identifying bottlenecks. By tracking these metrics, you can quickly detect performance issues such as slow consumers or high queue lengths, allowing you to take corrective actions before they impact the system.
2. Set Baselines and Thresholds
Define normal operating ranges for key metrics to establish baselines. Setting thresholds based on these baselines allows you to detect anomalies early. For example, suppose message rates or queue lengths exceed predefined limits. In that case, an alert can be triggered to investigate the cause and resolve any underlying issues before they lead to performance degradation or downtime.
3. Track Long-Lived Queues
Identify and address queues with excessive message accumulation. Long-lived queues with large numbers of messages may indicate a performance issue, such as slow consumers or improperly optimized producers. By tracking the age of messages in queues, you can identify potential bottlenecks and take proactive steps to ensure messages are processed efficiently and promptly.
4. Monitor Dead Letter Queues (DLQs)
Track rejected or undeliverable messages in Dead Letter Queues (DLQs). DLQs can provide valuable insights into incorrect routing, consumer failures, or message validation errors. Monitoring DLQs helps you perform root cause analysis and resolve underlying problems, ensuring messages that fail to be delivered are correctly handled and not lost.
By following these best practices, you ensure that RabbitMQ remains efficient, reliable, and scalable, reducing the likelihood of disruptions and improving overall system performance.
Configuring Alerts for RabbitMQ
Setting up alerts for RabbitMQ is critical for proactive monitoring and system stability. By defining alert thresholds and monitoring key metrics, you can address potential issues before they cause disruptions. Below are the common alerts to configure, along with tools to enhance alert management and optimize your RabbitMQ environment.
Common Alerts to Set Up
These are the essential alerts to configure in RabbitMQ to ensure performance and reliability.
1. Queue Backlogs
Set up alerts for high queue lengths or queues with no consumers. A backlog indicates that messages are not being processed promptly, which can lead to delays and system congestion. By monitoring queue length and consumer status, you can take corrective actions such as scaling consumers or addressing slow processing issues before they affect system performance.
2. Consumer Latency
Trigger alerts for slow message processing to identify delays in consumer performance. High consumer latency can cause message delays, impacting your system's overall flow of data. Setting up alerts for message processing times ensures that slow consumers are detected early, allowing immediate investigation and resolution.
3. Node Resource Usage
Please notify us of high CPU, memory, or disk usage within RabbitMQ nodes. Excessive resource usage may indicate processing bottlenecks, resource contention, or hardware limitations. Configuring these alerts helps ensure that your nodes operate within acceptable limits and prevents potential slowdowns or crashes caused by overloaded resources.
4. Connection Errors
Set up alerts for frequent connection drops or authentication failures. Connection errors can disrupt the flow of messages between producers and consumers. Monitoring connection stability helps you identify underlying issues such as network problems, misconfigurations, or authentication errors, allowing you to take corrective actions before they affect message delivery.
Using Prometheus Alertmanager for RabbitMQ
Prometheus Alertmanager allows you to define custom alert rules based on RabbitMQ metrics. By integrating Prometheus with RabbitMQ, you can scrape metrics such as message rates, queue lengths, and resource usage. Alertmanager enables you to set thresholds for these metrics, triggering alerts when conditions exceed predefined limits. This helps automate incident detection, streamline troubleshooting, and maintain system stability.
Third-Party Alerting Tools
Using third-party tools for RabbitMQ alerting can enhance monitoring capabilities and provide real-time notifications.
1. Set up alerts in Datadog, New Relic, or ELK Stack for real-time notifications.
Integrate RabbitMQ with platforms like Datadog, New Relic, or ELK Stack to create custom alerts and gain detailed insights into your RabbitMQ environment. Datadog and New Relic provide comprehensive monitoring with powerful visualizations and real-time notifications. ELK Stack, on the other hand, offers log-based alerting, allowing you to track logs from RabbitMQ for error analysis, system health checks, and trend monitoring. These tools provide deep integration and make managing and troubleshooting RabbitMQ systems easier.
2. Doctor Droid Integration
Integrating Doctor Droid into your RabbitMQ alerting setup provides AI-driven insights to optimize alert configurations. Doctor Droid helps reduce alert noise by filtering out unnecessary notifications and prioritizing critical alerts. By analyzing historical alert data, Doctor Droid can fine-tune your alerting system, ensuring that your team is only alerted about the most impactful issues. This allows for faster decision-making, better incident response, and improved overall monitoring efficiency in your RabbitMQ environment.

By setting up these alerts and utilizing these tools, you can ensure better RabbitMQ monitoring and proactively manage performance, availability, and scalability.
Optimizing RabbitMQ Performance with Alerts
Using alerts effectively can significantly optimize RabbitMQ performance by allowing you to address issues before they cause disruptions. Below are key strategies for using alerts to improve system performance, scalability, and availability.
1. Proactive Scaling
Set up alerts to identify when scaling is required for queues or consumers. If message queues become too large or consumers cannot keep up with the rate of incoming messages, scaling can help maintain smooth operations. Alerts notify you when these thresholds are reached, allowing timely intervention to add more resources or scale the system as needed.
2. Addressing Bottlenecks
Use alerts to resolve issues like slow consumers or overloaded queues. If a consumer takes too long to process messages or back up queues, these issues can lead to delays and performance degradation. By monitoring key metrics and setting up alerts for high queue lengths or slow message processing, you can address bottlenecks quickly, ensuring optimal throughput and response times.
3. Cluster Health Monitoring
Ensure high availability and consistency across RabbitMQ clusters by monitoring key metrics like node status, replication health, and network partitions. Alerts for node failures or network splits allow you to take corrective action quickly, ensuring your RabbitMQ cluster remains resilient and operational. Regular health checks help avoid unexpected downtimes or data inconsistency.
By optimizing RabbitMQ performance through proactive scaling, bottleneck resolution, and cluster health monitoring, you ensure your system can handle increased loads while maintaining reliability and efficiency.
Avoiding Alert Fatigue
Effective alerting is crucial for maintaining system health, but too many notifications can lead to alert fatigue. To avoid overwhelming your team and ensure they focus on essential issues, follow these strategies to optimize your alerting setup.
1. Group and Deduplicate Alerts
Combine related alerts into a single notification to avoid notification overload. This reduces the noise from duplicate alerts and allows your team to focus on the core issue. Grouping similar alerts ensures you don’t overwhelm your team with repetitive messages, enabling quicker and more effective responses.
2. Dynamic Thresholds
Use AI-driven tools like Doctor Droid to adjust thresholds based on trends automatically. These tools analyze your system's behavior and quickly adapt the alert thresholds, preventing false alarms. Dynamic thresholds ensure you only receive alerts when there's a significant issue, keeping your alert system efficient and focused.

3. Prioritize Critical Metrics
Focus on actionable alerts that directly impact system reliability. By prioritizing key metrics such as CPU usage, message rates, or replication health, you ensure that your team receives only notifications essential for maintaining system performance. This reduces noise and ensures efficient decision-making.
Also read: Beyond CPU Metrics: Building a User-Centric Alert Strategy
By optimizing how you manage alerts, you can avoid alert fatigue and maintain a responsive, effective monitoring system. For better alert management, consider integrating Doctor Droid's AI-driven alert intelligence to help prioritize, deduplicate, and optimize your RabbitMQ alerting strategy.
Tools for RabbitMQ Monitoring and Alerting
Effective RabbitMQ monitoring and alerting require the right tools to collect metrics, visualize data, and ensure prompt issue resolution. Below are the most effective tools you can use to monitor and alert for RabbitMQ, each offering unique capabilities for optimal performance.
1. Native Tools
The RabbitMQ Management Interface provides an out-of-the-box solution for essential monitoring, offering a real-time view of queues, exchanges, nodes, and message rates. This built-in tool enables easy access to key metrics and allows for basic alerting, helping you track RabbitMQ health and performance without needing third-party integrations.

2. Prometheus and Grafana
Prometheus and Grafana form a powerful open-source stack for metrics visualization and alerting. Prometheus scrapes data from RabbitMQ, while Grafana provides customizable dashboards for visualizing key metrics like queue lengths, message rates, and resource utilization. This combination allows you to monitor RabbitMQ flexibly and set custom alerts for efficient performance management.
3. Datadog and New Relic
Datadog and New Relic are comprehensive observability platforms offering advanced RabbitMQ monitoring and alerting features. These platforms provide detailed insights into RabbitMQ performance, such as message throughput, latency, and resource usage. They also offer sophisticated alerting mechanisms, enabling real-time notifications for critical issues to ensure timely responses and minimize downtime.

Also read: Terminologies & Concepts Around Alerting in Datadog
4. Doctor Droid
Doctor Droid uses AI-driven insights to optimize RabbitMQ alerts, enhancing performance while reducing noise. By analyzing past alert data, Doctor Droid automatically prioritizes and filters out unnecessary notifications, allowing your team to focus on the most pressing issues. This streamlines RabbitMQ alerting workflows and improves overall efficiency.

Using these tools, you can optimize your RabbitMQ monitoring and alerting setup, ensuring a more efficient, reliable, and responsive messaging system.
The Doctor Droid Slack integration provides real-time notifications for ElastiCache alerts, helping teams quickly identify performance issues, collaborate on resolving them, and take immediate action to minimize downtime and optimize cache performance.
Conclusion
In this blog, we've explored the best practices for monitoring and alerting RabbitMQ, including tracking key metrics such as queue lengths, message rates, and consumer performance. We also discussed setting baselines, defining thresholds, and monitoring RabbitMQ's health to ensure a high-performing and reliable system. Configuring alerts effectively helps address issues proactively before they cause disruptions.
Doctor Droid is critical in streamlining alert workflows and enhancing RabbitMQ observability. By leveraging AI-driven insights, Doctor Droid helps optimize alert configurations, prioritize critical issues, and reduce noise, ensuring your team remains focused on the most important alerts. It empowers your RabbitMQ monitoring system to be more efficient and responsive.
Ready to optimize your RabbitMQ alerting system?
and take your monitoring to the next level.
Missing from this list: an AI that actually fixes the issue →
Connect your tools and ask AI to solve it for you
Ready to cut the alert noise in 5 minutes?
Install our free slack app for AI investigation that reduce alert noise - ship with fewer 2 AM pings
Frequently Asked Questions
Everything you need to know about observability pipelines